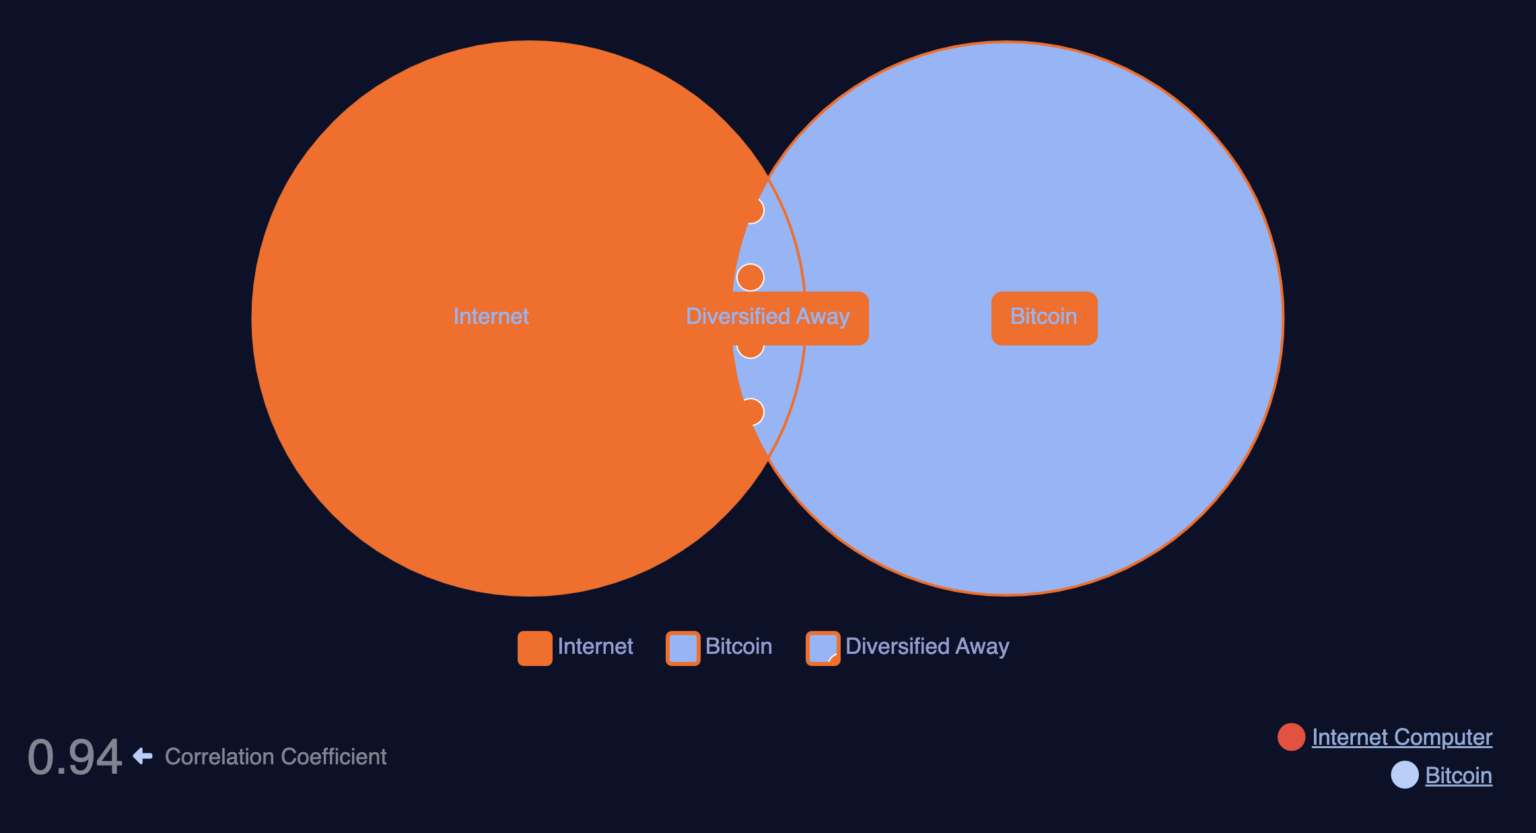
Not all cryptocurrencies tend to move together, but Internet Computer (ICP) has been moving with Bitcoin for a while. Will the altcoin eventually carve its own path? This on-chain analysis shows that investors are uncertain about this in the short term. According to Macroaxis data, the 90-day correlation between ICP and BTC was recorded at 0.94.
What’s Happening on the ICP Front?
During this period, a correlation coefficient of 1 or close to it means that the prices of the two cryptocurrencies often move in similar directions, but a coefficient close to -1 indicates a strong divergence. In the 90-day horizon, Internet Computer, especially since it has provided negative returns, is dragging down Bitcoin’s performance. In the same timeframe, Bitcoin’s price return is not impressive.

However, the strong correlation may be linked to ICP’s resurgence in the last 30 days; during this period, the price increased by 23.55% while moving in sync with Bitcoin. Additionally, off-chain developments suggest that a stronger correlation is possible. This is due to Copper.co, a collateral management firm for crypto assets, facilitating cross-chain infrastructure that supports Bitcoin interaction on the Internet Computer ecosystem.
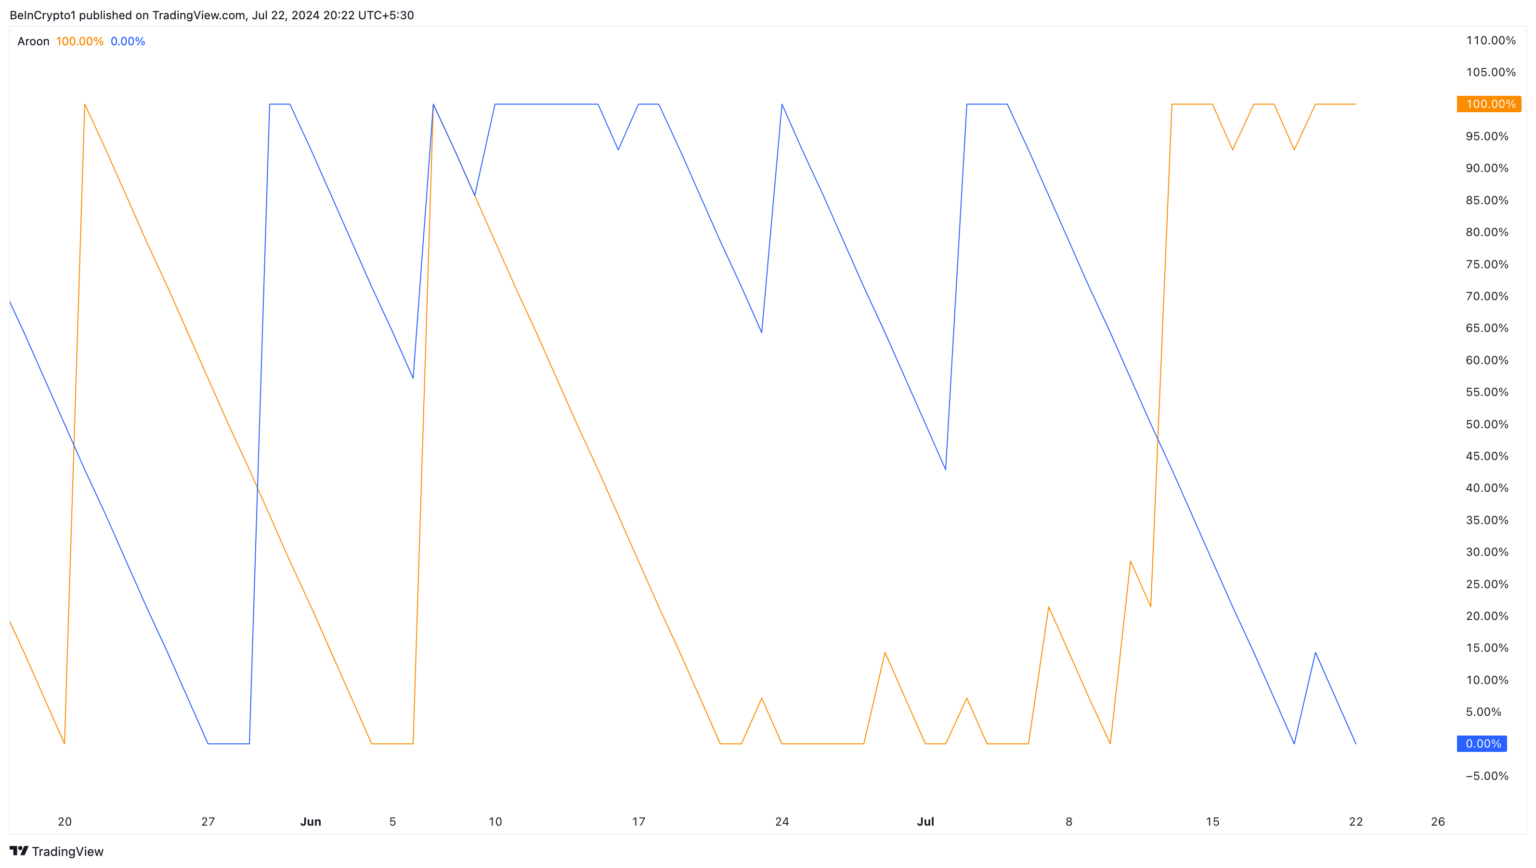
The Aroon indicator predicts that ICP’s price will increase. This indicator has two lines: Aroon Up (orange) and Aroon Down (blue). In summary, it shows whether a cryptocurrency’s price has started a new trend, changed, or continued in a specific direction.

ICP Chart Analysis
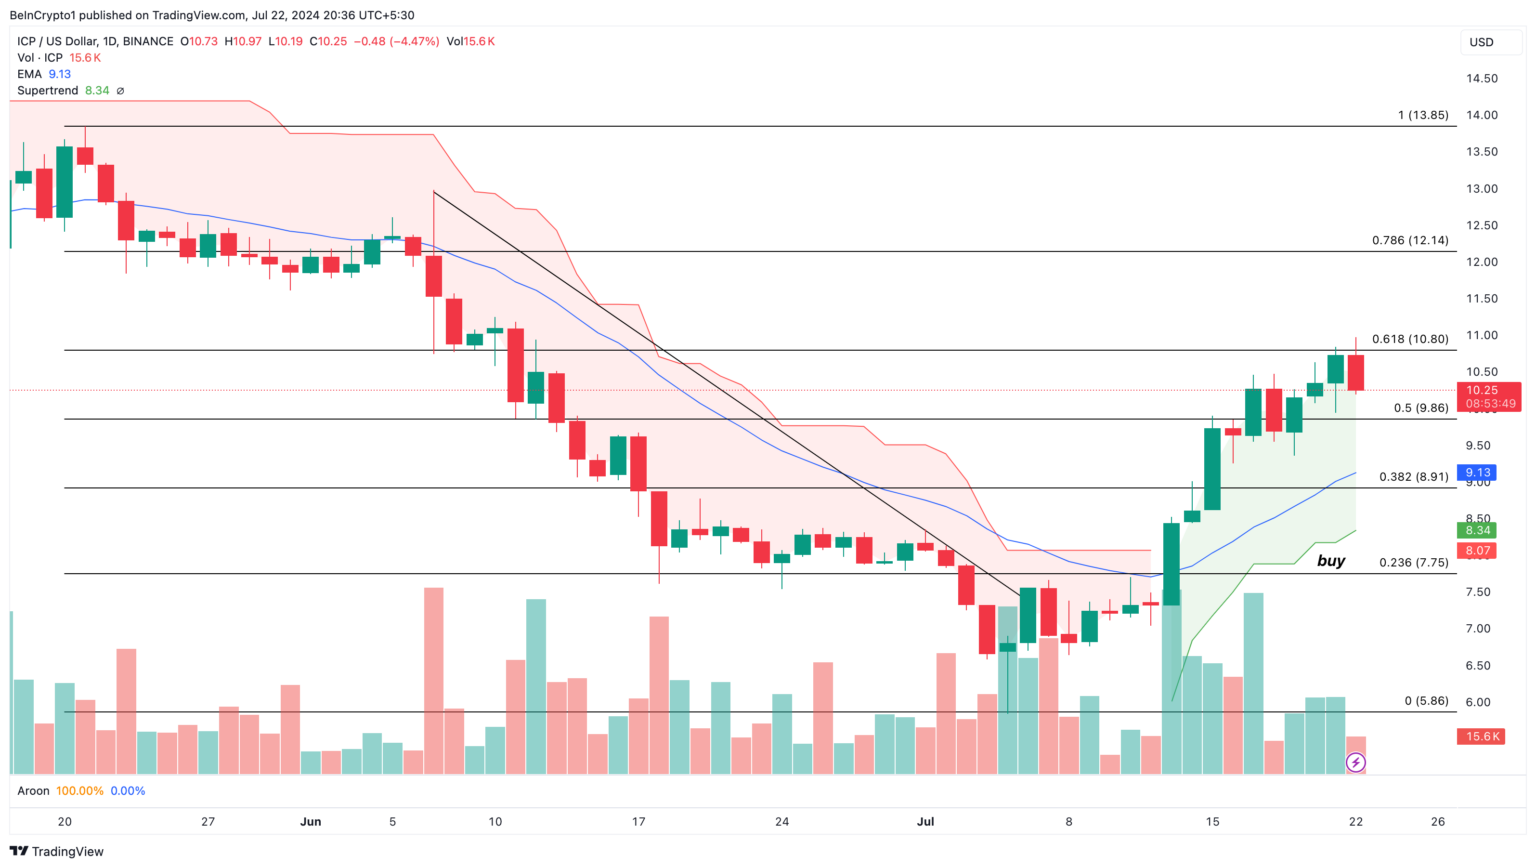
ICP broke above the downtrend on July 6, which was crucial for its recent rise. The token is trading at $10.25, staying above the 20 EMA average (blue) positioned at $9.13. EMA stands for Exponential Moving Average. When the price is above this, the trend is upward, but when below, the trend is downward. Therefore, the current ICP condition implies that the token’s chance of rising is higher than falling.
Additionally, Supertrend gave a buy signal at $8.34. This technical analysis tool shows the trend that the cryptocurrency follows. If the red zone appears above the price, it is a sell signal, and the price may show a downward trend. The green segment of the Supertrend is below the ICP price, indicating that the token value could be higher.

If buying pressure increases, the Fibonacci Retracement indicator reveals that ICP could reach $10.80. If the bulls maintain the uptrend, the price could reach $12.14 in the coming days. However, if the token price falls below the 20 EMA average, this prediction may not materialize. In such a case, ICP’s price could drop to $9.86.


