With sellers closely monitoring Bitcoin‘s price movements, the cryptocurrency stayed near $66,000 on April 23. Data from TradingView revealed a new trading range that has persisted since the last weekly close. Although generally higher than last week, the BTC/USD pair has inspired little optimism among bulls.
What to Expect for Bitcoin?
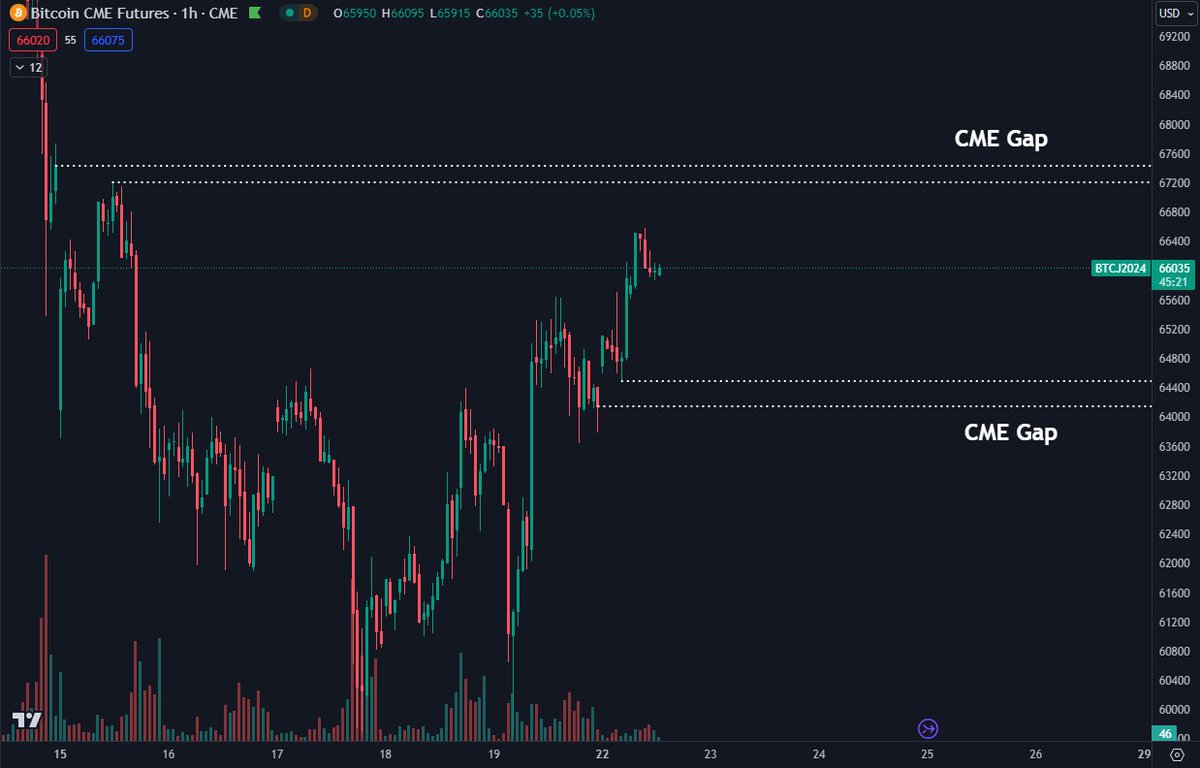
On the Bitcoin front, an overnight rise to $67,200 failed to close a nearby CME Group Bitcoin futures gap. This, combined with another gap at $64,400, forms short-term Bitcoin price targets that have yet to be reached.
Analyzing the current situation, popular analyst Marco Johanning identified $66,700 as the key level Bitcoin needs to convert to support future advancements. In a post shared on platform X, he stated:
“Looking at the range, Bitcoin reclaimed the middle range and was then sent from there. However, so far it has not managed to shift the next level of $66,700. Today’s key level is this.”

“Both scenarios assume the short-term trend will continue and move towards the higher range.”
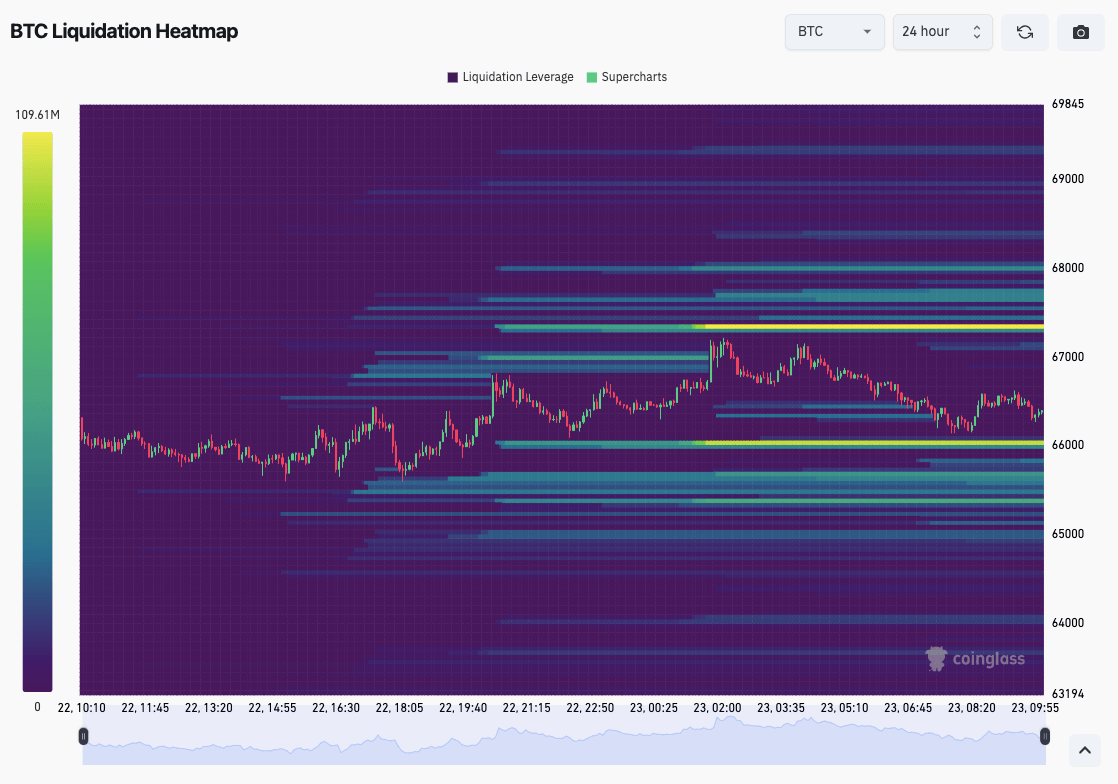
The mentioned post continues to show bids and asks tightly wrapped around the spot price in exchange order books, reflecting the current liquidity landscape. Data from blockchain analytics platform CoinGlass confirmed that on that day, $66,000 and $67,350 were the major support and resistance levels respectively.

Key Data to Watch on the Bitcoin Front
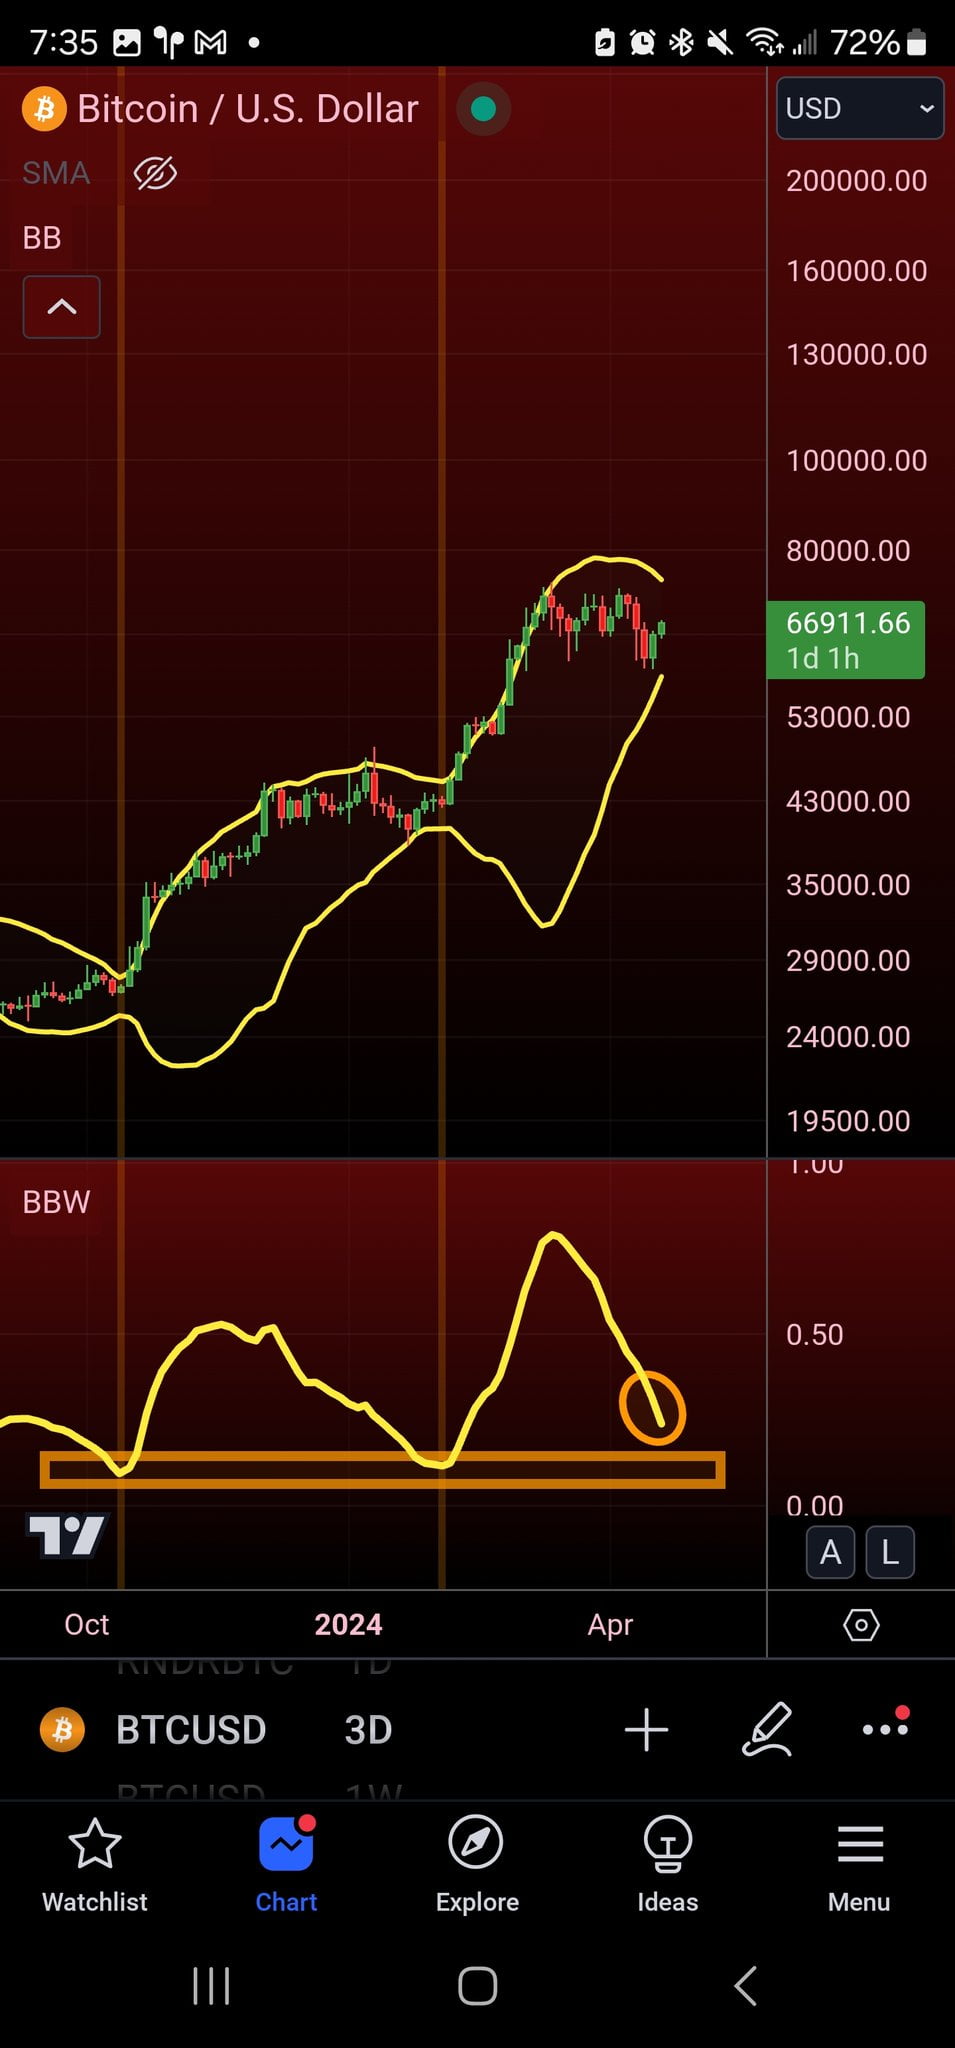
Meanwhile, the expectation of a larger Bitcoin price movement remains in the background. According to popular trader and analyst Matthew Hyland, changing conditions in the Bollinger Bands over 3-day periods indicate an imminent breakout, either upwards or downwards.
The current narrowness of the Bands, a classic volatility data point, is the narrowest since mid-February when the BTC/USD pair last traded below $50,000. During this period, many analysts have discussed the width of the Bollinger Bands and its impact on Bitcoin price movements.


