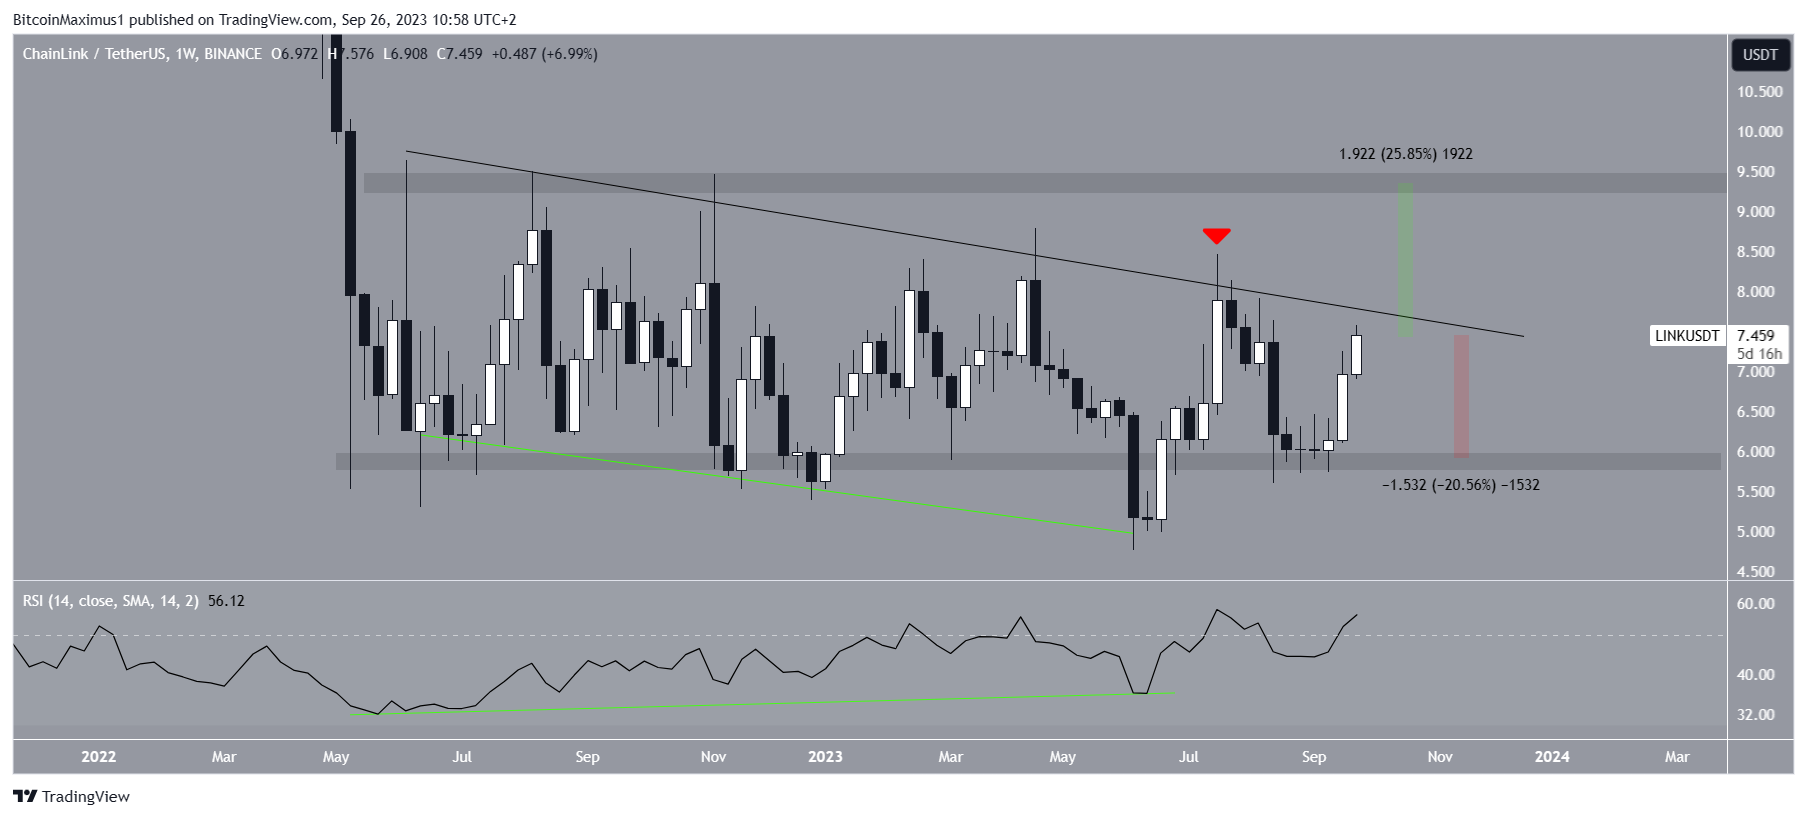
Chainlink‘s (LINK) price has broken out of the descending resistance line and is approaching the highest level of the year. According to experts, readings on the weekly and daily timeframes support the ongoing increase towards new highs. So what are the expectations for this altcoin?
LINK Price Movement!
According to technical analysis on the weekly timeframe, the price of LINK has been increasing since it dropped to $4.75 in June. This price increase led to the reclaiming of the horizontal support area at $5.80, which has been in place since April 2022. Although this is considered a bullish sign, LINK has not been able to break out of the descending resistance line. Despite this failure, the price is making another attempt to do so.
The upward movement is also accompanied by a bullish trend in the weekly RSI. RSI is a momentum indicator used by investors to assess whether a market is overbought or oversold and to determine whether a token should be accumulated or sold. Readings above 50 and a bullish trend indicate that bulls still have the advantage, while readings below 50 indicate the opposite. When a price decline is combined with an increase in momentum, a bullish trend emerges, which often leads to a reversal of the upward trend.
If a breakout occurs from the long-term descending resistance line, the price of LINK could increase significantly. In this case, the nearest resistance could be $9.40, representing a 25% increase from the current price. On the other hand, a return to $5.80 could mean a 20% decrease. The price of LINK first broke out of a descending resistance line on September 18, indicating the end of the previous downward movement.

Notable Metric in LINK!
The Elliott Wave count also supports the ongoing increase. Expert analysts use the Elliott Wave theory to determine the direction of a trend by examining recurring long-term price patterns and investor psychology. There are two potential scenarios for future movement, and both could lead to a short-term increase in the price of LINK.
The bearish count indicates that the upward movement is part of an ABC corrective structure. Giving a 1:1 ratio to the A:C waves could lead to a high near $9.50, consistent with the long-term resistance area. The bullish count indicates that the price is currently in the third wave of a five-wave increase. In this case, the third wave is likely to extend, and LINK could break the long-term descending resistance line, reaching a high level of at least $12. However, a sudden loss of momentum or rejection of the descending resistance line could result in a 20% decrease to the horizontal support area at $5.90, despite this price prediction for LINK’s rise.

 Türkçe
 Español


