The price of Dogecoin seems to have gained momentum on Friday, fueled by the renewed bullish expectations in the market and the developments related to the approval of the first Ethereum futures ETFs, which are set to start trading on October 3rd. The largest meme coin has responded very positively to the news, along with other major cryptocurrencies.
Bitcoin rose by 2% to $26,970, Ethereum increased by 3% to $1,650, and XRP climbed by 2.4% to $0.509 on Friday. The impact of this upward movement shaped in a positive direction as the total market value rose by 2.1% to $1.1 trillion.
Dogecoin Current Status
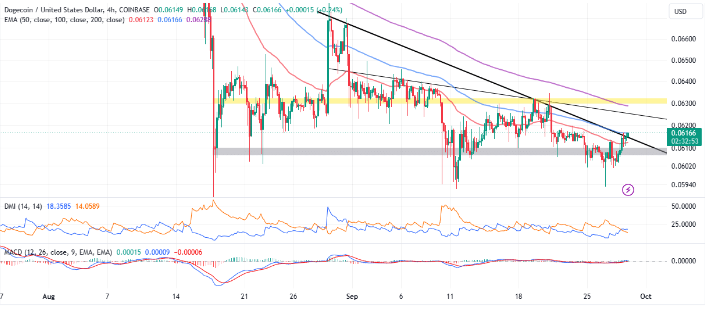
The price of Dogecoin has established its upward trend after trading above the key levels that started with the support of $0.06, followed by the 50-day Exponential Moving Average (EMA) (red) and a month-long descending trend line.
Indicators such as Moving Average Convergence Divergence (MACD) and Directional Movement Index (DMI) appear to be structured to support the growing bullish trend. Investors can further reinforce their DOGE expectations by ensuring that the blue MACD line is above the red signal line. The momentum indicator is above the average line (0.00) and continues to rise, confirming the upward trend.

Speaking of DMI, a bullish signal emerged when the blue +DI line crossed above the -DI line. This indicator is used to measure the strength and direction of the trend. If there is a change in the +DI and -DI movement, the price of Dogecoin could be on the verge of a correction.
Despite the bullish signals, investors may reconsider waiting for the resistance of the 100-day EMA (blue) to be broken before reinitiating their long positions. Such a move could trigger an increase in trading volume and thus invite more investors to invest in DOGE.
Dogecoin Price Prediction
Sellers are indicating the possibility of a reversal from potential resistance areas between $0.062 and $0.063, such as the descending trend line. Once out of the line, the focus could target the next resistance at $0.063, with the 200-day EMA (purple) slightly below $0.0628.
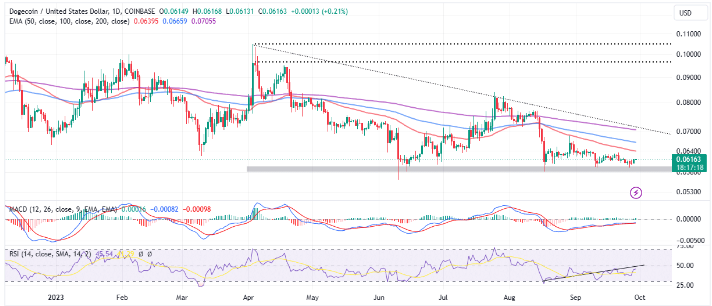
A breakthrough above this price point could trigger the next bull run for Dogecoin. While the MACD maintains its upward outlook on the daily chart, the Relative Strength Index (RSI) continues to strengthen the upward trend.
However, it may be beneficial for investors to exercise caution as DOGE remains below the three main moving averages on the daily chart. This situation could disadvantage the bulls, giving sellers many potential opportunities to capitalize on Dogecoin and reduce the upward trend.
The first and most important upward movement based on the daily chart could be to break out of the narrow range channel with the upper limit of $0.064, reinforced by the 50-day EMA. Another bullish signal could occur if DOGE surpasses the multi-month descending trend line around $0.07 and encompasses the 200-day EMA. The path between this zone and $0.1 could be relatively clear.


 Türkçe
 Español


