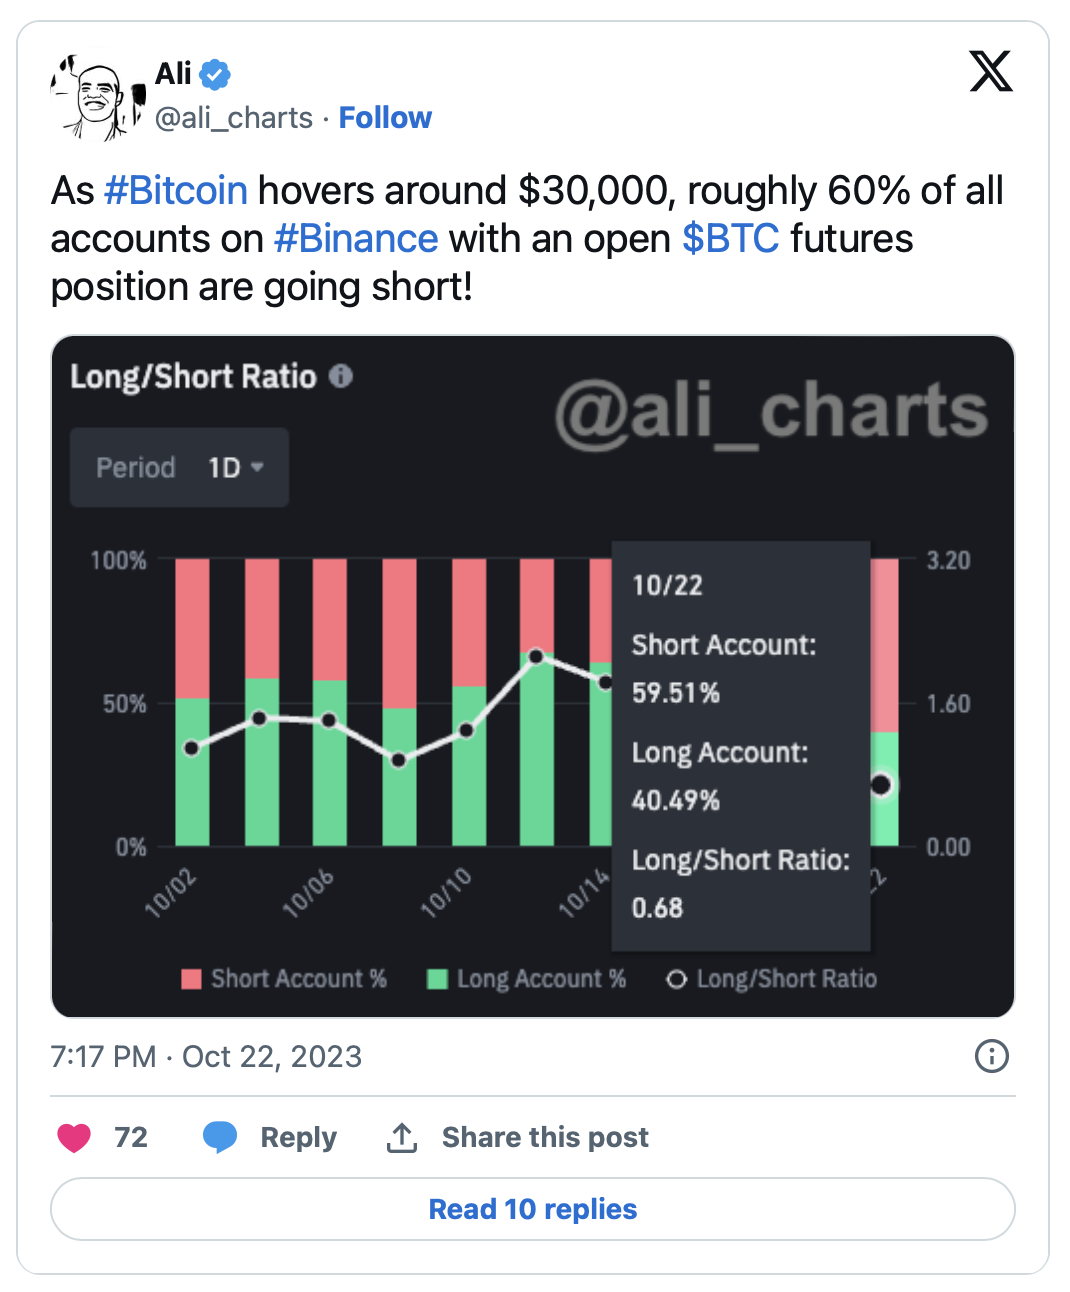
The world’s largest cryptocurrency, Bitcoin (BTC), has continued its strong upward trend and surpassed the $30,000 level. Derivative data shows that the price increase has once again led to a buildup of short positions in BTC.
Bitcoin Surpasses $30,000 with Increasing Short Positions
Experienced cryptocurrency analyst Ali Martinez reported that approximately 60% of Binance accounts with open BTC futures positions have opened short positions when Bitcoin was at around $30,000.

The analyst also warned that the chart of Bitcoin signals an upcoming price correction in the largest cryptocurrency. Martinez stated that there is a growing discussion about the potential development of a head and shoulders formation on Bitcoin’s daily chart.
Furthermore, the TD Sequential indicator on the Bitcoin chart shows the presence of nine green candlesticks, indicating a potential sell signal in the daily chart tomorrow. Additionally, the Relative Strength Index (RSI) has reached a level of 74.21, which has triggered significant corrections since March. Martinez commented, “It seems that if Bitcoin fails to close above $31,560 on the daily time frame, there will be a minor price correction.”

Bitcoin’s Superior Performance
Bitcoin has experienced an extraordinary rally since the beginning of the year, gaining over 80% during this period. The world’s largest cryptocurrency has outperformed altcoins and stocks despite macro challenges. The currently soaring US 10-year Treasury yields, which are at the highest levels in the past 16 years, have affected Ethereum (ETH) and other altcoins but have not had the same impact on Bitcoin. News of the potential approval of a spot Bitcoin ETF by the US Securities and Exchange Commission (SEC) has been a catalyst for the recent price rally.
Currently, investors are locked in a fierce battle around the $30,000 level in Bitcoin, and the fact that buyers have not yet managed to secure a significant breakout from this key area is indicative of this. Furthermore, the ongoing consolidation near this point indicates the bulls’ reluctance to convert their gains into cash, as they anticipate a potential upward move. This situation could potentially push the price towards the resistance zone between $31,000 and $32,400.
On the other hand, a pullback from the $31,000 level could push the price down to $28,160, which corresponds to the 20-day Exponential Moving Average. A bounce from this level could once again prompt the bulls to make a breakthrough move.

 Türkçe
 Español


