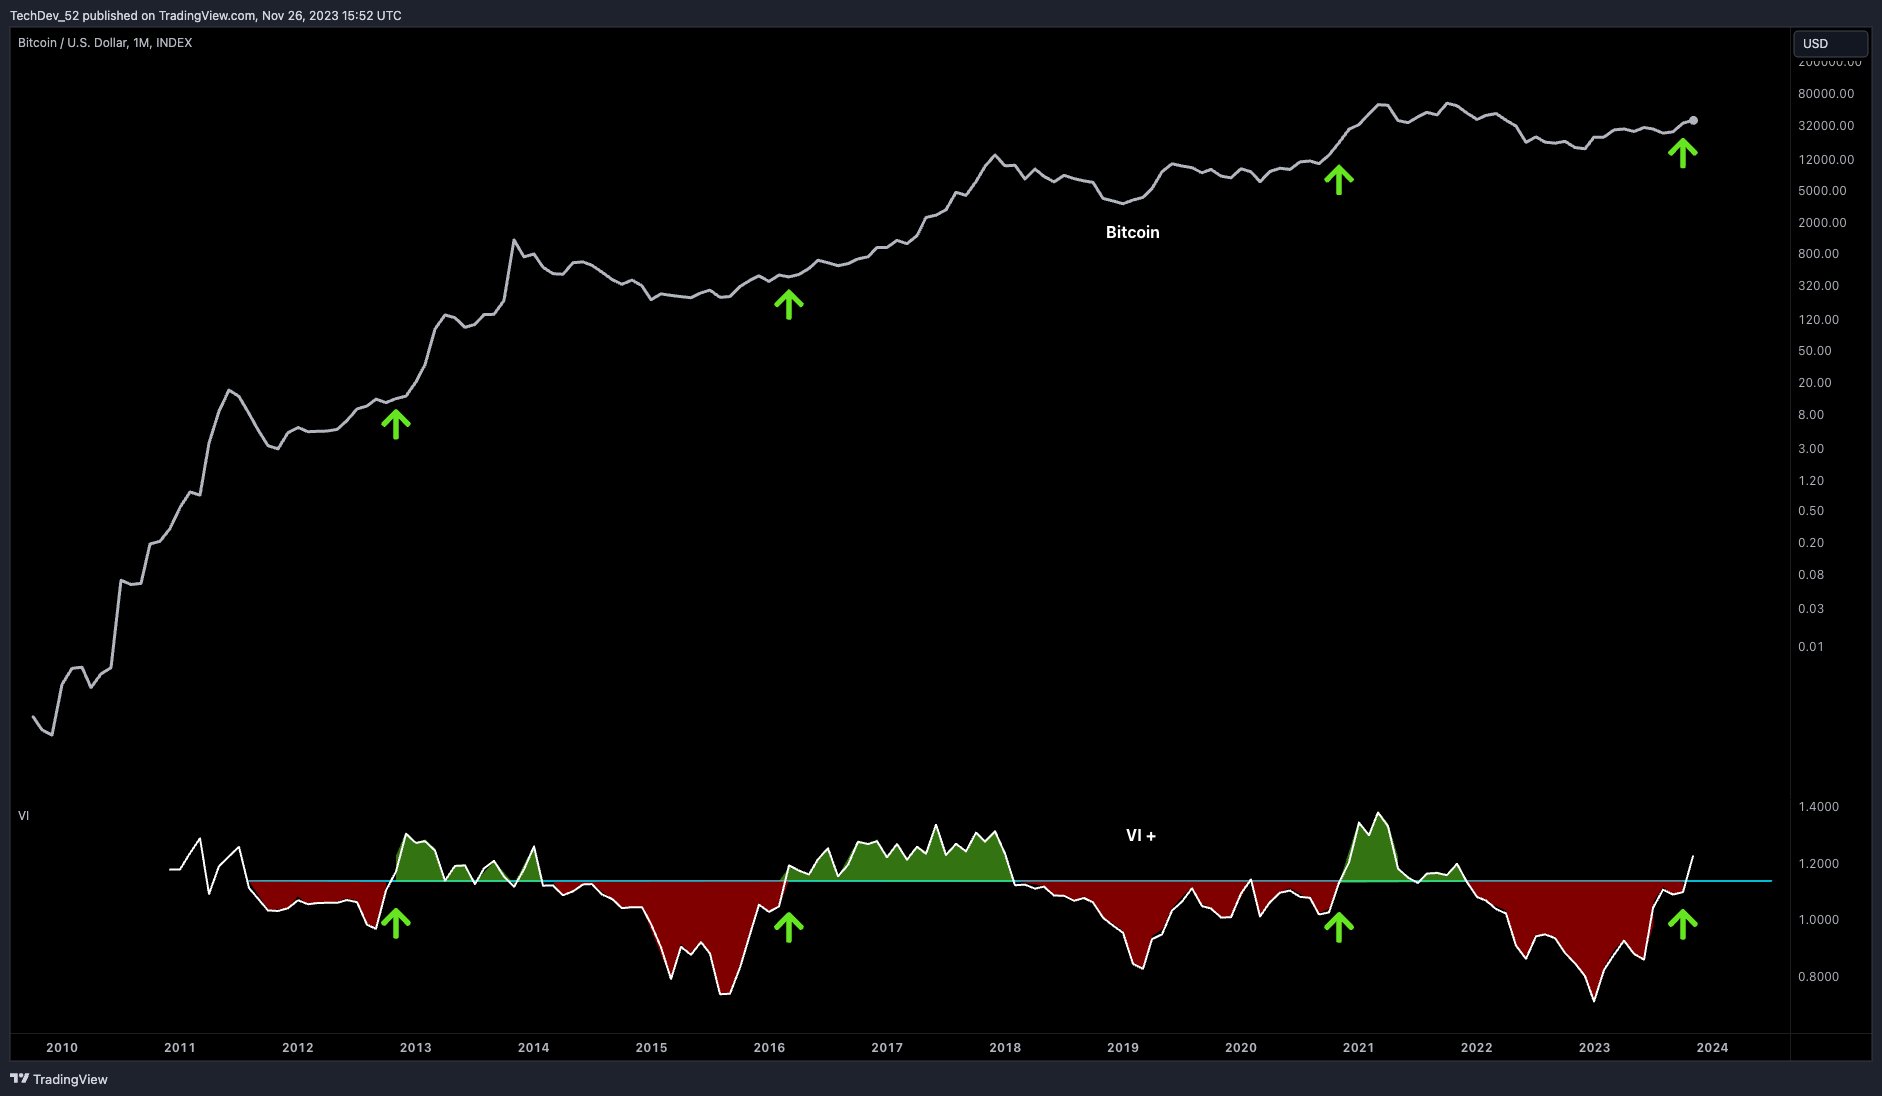
The closely followed crypto analyst TechDev claimed that Bitcoin (BTC) appears to be repeating a model in the price graph of Amazon (AMZN) shares from over a decade ago. According to the analyst, the largest cryptocurrency could be in the middle of this model.
Bitcoin vs Amazon
The anonymous crypto analyst TechDev shared a graph on social media platform X (formerly Twitter) comparing Bitcoin’s price movement over the last 3 years with the AMZN share graph in 2010 and 2011.

According to the analyst, BTC shows extreme similarity to the AMZN share graph, which fell sharply after a parabolic move to its all-time high (ATH), following a double top formation and then moved with little or no decline.
From this perspective, TechDev said, “That’s when AMZN tested the previous all-time high with an extended horizontal correction, just like BTC is doing. The structural similarities in both graphs are currently striking. The green line shows the movement BTC has made since this graph.”
TechDev Expects BTC to Move Towards New Peaks
TechDev stated that he expects Bitcoin to move towards new peaks, saying, “If you can leave the narrative of the block reward halving behind, a quick move to new peaks from here and retesting the previous ATH would not be unusual. Of course, there is no guarantee for this. The scenario of retesting the $32,000 support is still on the table, but I would not be surprised if we only go up to new peaks from here. Structural models work because the mass speculative behavior of people does not change regardless of the asset.”

The analyst had previously highlighted the Vortex Indicator (VI), designed to detect Bitcoin’s trend reversals and confirm current trends. TechDev shared a monthly timeframe Bitcoin chart showing that VI has a near-perfect past in giving a bull market signal and claimed that the indicator is giving a parabolic rally signal for the largest cryptocurrency.

 Türkçe
 Español


