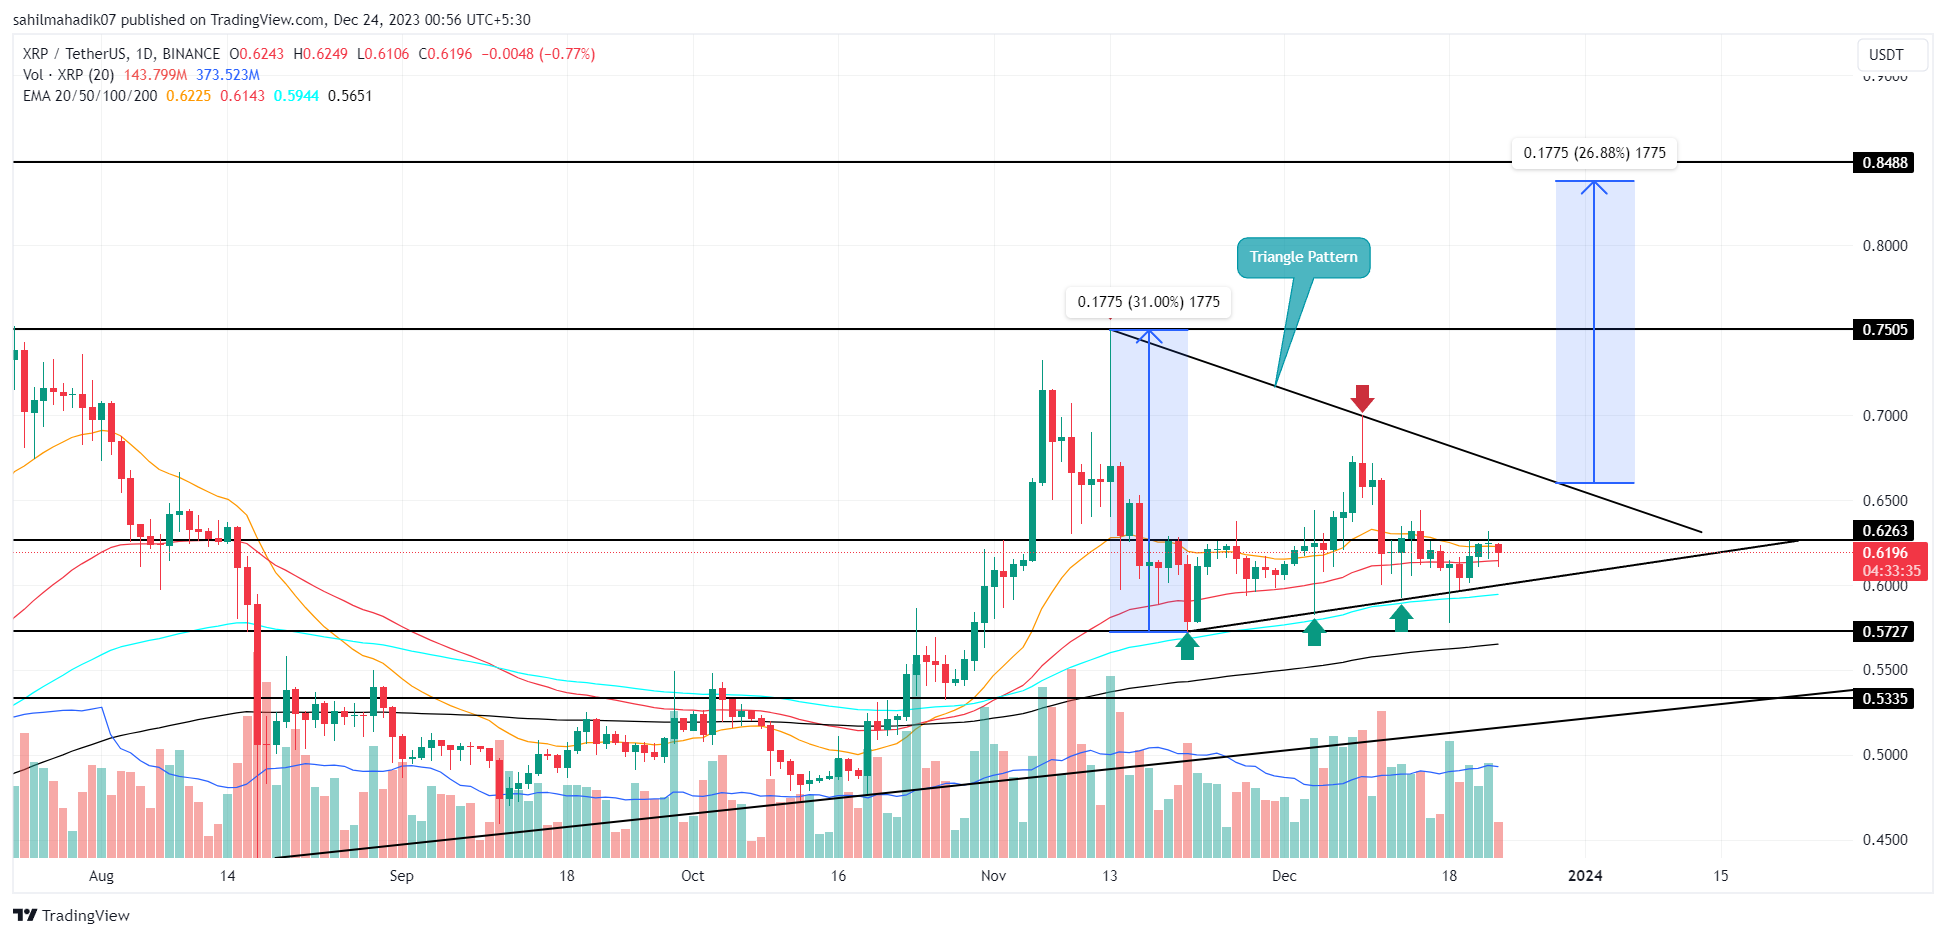
The cryptocurrency market has been experiencing a period of uncertainty, during which the price of XRP has followed a horizontal trend. Amidst this indecision, a combined support at the $0.6 level and the ascending trend line of a triangular formation have acted, and continue to act, as a barrier against a decline, preventing a significant correction. A retest of this support could increase buying pressure and may offer buyers an opportunity to exit the consolidation phase.
Can the $0.6 Level Provide Support for XRP?
The daily time frame chart shows that XRP’s price movements are forming a symmetrical triangle pattern. Despite high volatility, investors continue to make investment decisions based on this pattern, as evidenced by multiple reversals and bounces within the triangle formation.

The popular altcoin is currently trading at $0.619 and is facing a slight pullback from the local resistance level of $0.63, as indicated by the evening star candlestick pattern. This could lead to a minor 2% drop in XRP’s price before it revisits the lower trend line of the symmetrical triangle formation.
The possibility of the price rebounding from the lower trend line and potentially rising by 6% to reach $0.653, which corresponds to the upper trend line, is gaining strength. However, a significant move from XRP is unlikely as long as the symmetrical triangle pattern remains unbroken. A breakout above this pattern could see the price initially move to the horizontal resistance line at $0.75, and if it surpasses this line, it could rise to as high as $0.84.
For a Directional Rally, the Triangle Formation Must Be Broken
The current market outlook for XRP is neutral, and a downward break below the lower trend line of the symmetrical triangle formation could increase selling pressure. Such a break could trigger a decline that reduces the price by 12%, pushing it down to $0.53 and towards the long-standing ascending support trend line. This support trend line, which has been in place for over a year, keeps XRP’s price in an uptrend and offers investors an opportunity for accumulation.
Currently, the Relative Strength Index (RSI) of the altcoin on the daily time frame is at the 50 level, indicating a neutral sentiment among investors. However, the price being above the 100 and 200 Exponential Moving Averages (EMAs) suggests that the long-term trend is bullish.

 Türkçe
 Español


