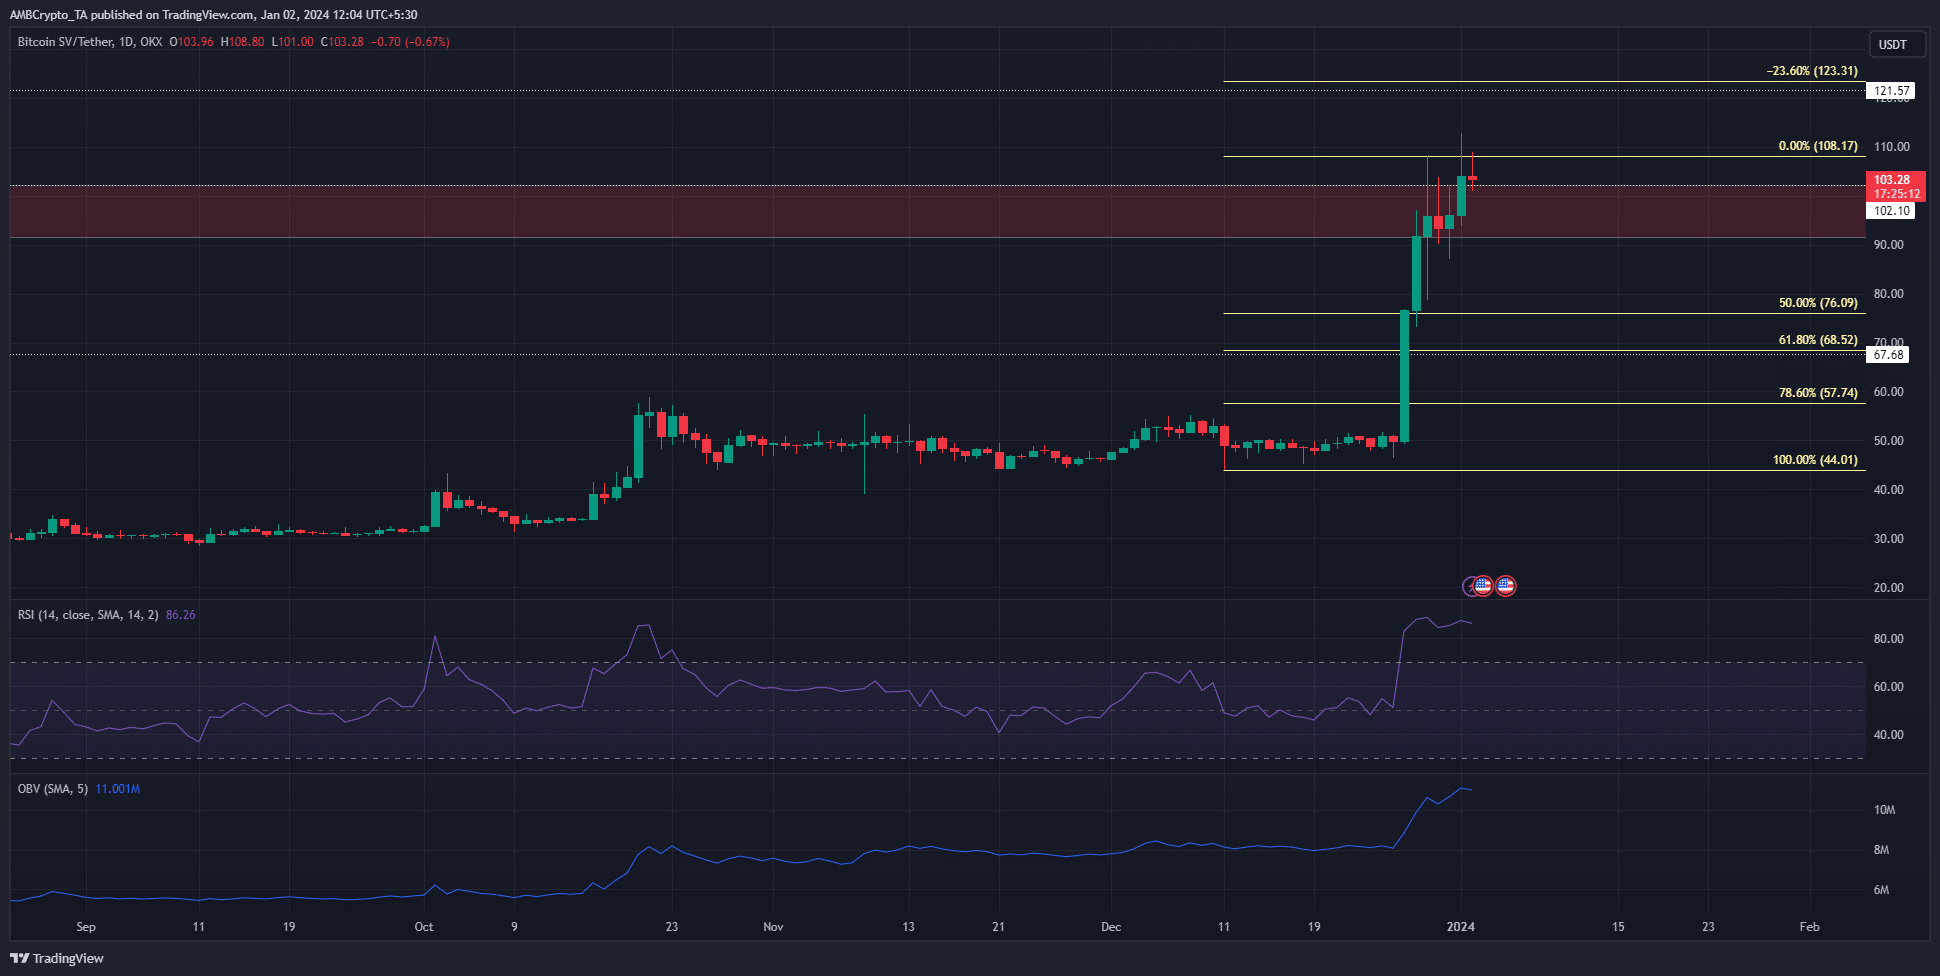
Bitcoin SV (BSV) recorded excellent gains last week. It traded at $44 on December 11 and rose to $108 on December 29. This movement was measured as a 145.8% increase. Moreover, the weekly resistance area was also broken.
Will BSV’s Rise Continue?
In the last few days, a slight decrease in open positions in BSV contracts was noticed. This could mean that the bullish sentiment has weakened a bit. Could this lead to a larger pullback? The daily chart of the cryptocurrency shows that BSV’s market structure is in a strong upward trend.
Additionally, the Relative Strength Index (RSI) was well above 70, reflecting the momentum’s strength from the past week. The On-Balance Volume (OBV) also took a significant step upwards to highlight the buying pressure. The area between $91.5 and $102.1 was emphasized as a bearish order block in the weekly timeframe. Moreover, the $100 level is psychologically important. Therefore, the move towards $108 is significant.

Current Data on BSV
If the bulls can defend the $100 level and push prices above $108, it could signal the start of the next bullish movement. The 23.6% Fibonacci extension level at $123 and the 61.8% level at $147 are the next targets. The open interest chart can be a good barometer of market sentiment. Despite strong resistance around $110 in the last three days, BSV prices have gradually trended downwards. However, OI has shown a decline since December 30.
This suggests that sentiment in the short term is in favor of the bears. Participants were not willing to bet on further price increases. The spot Cumulative Volume Delta (CVD) also saw a decline. Therefore, a retracement to the weekly interest area from $91.5 to $102 in the coming days seems likely. This could be followed by another move towards $123 or higher.

 Türkçe
 Español


