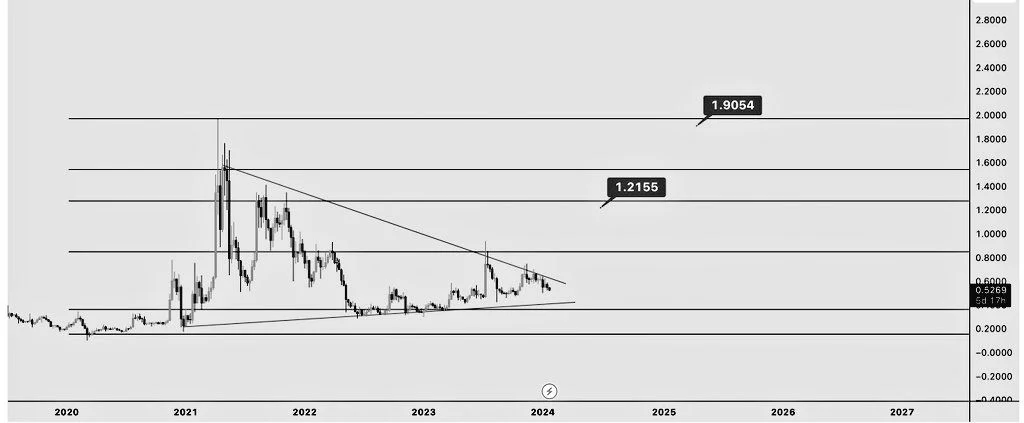
The popular altcoin Ripple‘s (XRP) price is at risk of breaking away from the rising support trend line that has been in place for approximately 400 days. XRP continued its short-term downtrend, another sign of a bearish trend. Could this be the start of a long-term correction?
Ripple Price Analysis
Experts’ weekly technical analysis indicates that the XRP price has been increasing alongside a rising support trend line since the beginning of 2023. The upward movement led to the highest level of 2023 in July, reaching $0.94. However, the price has fallen since then. After several bounces off the support trend line, XRP is finally parting from this line, although it has not yet reached its weekly close. Currently, the XRP trend line has been in existence for about 400 days.
The weekly Relative Strength Index (RSI) shows a downtrend. Investors use the RSI as a momentum indicator to assess market conditions, determining whether the market is overbought or oversold and whether a token should be accumulated or sold.

Expert Opinion on XRP
If the RSI value is above 50 and the trend is upward, the bulls are still at an advantage, but if the data is below 50, the opposite may be true. The indicator is below 50 and continues to decline. Both could be signs of a bearish trend. Despite the ongoing decline, cryptocurrency investors and analysts in XRP still indicate the possibility of an upward trend. A cryptocurrency analyst known as Bit_ Luxe stated that the price will soon rise above $1, highlighting a potential recovery despite the current downward pressure:
The TD Sequential indicator is giving a buy signal in the midst of the recent decline! Despite the downward pressure here, I see a potential recovery highlighting a buying opportunity!
In conclusion, Ripple’s price carries the risk of breaking from the 400-day support line, but some analysts are considering the possibility of a short-term recovery.

 Türkçe
 Español


