COINTURK NEWSCOINTURK NEWSCOINTURK NEWS
  • Real-Time News Feed
  • Bitcoin
  • Altcoin
  • Ethereum
  • Technology News
  • Advertise
  • Contact
  • TURTURTUR
  • ESESES
Search
© 2024 COINTURK NEWS. All Rights Reserved.
Reading: Cardano Price Analysis: A Technical Outlook
Share
Languages
  • TürkçeTürkçe
  • EspañolEspañol
Font ResizerAa
COINTURK NEWSCOINTURK NEWS
Font ResizerAa
Search
  • Real-Time News Feed
  • Bitcoin
  • Altcoin
  • Ethereum
  • Technology News
  • Advertise
  • Contact
  • TURTURTUR
  • ESESES
Follow US
© 2025 BLOCKCHAIN Information Technologies. >> COINTURK NEWS
Powered by LK SOFTWARE
COINTURK NEWS > Cardano (ADA) > Cardano Price Analysis: A Technical Outlook
Cardano (ADA)

Cardano Price Analysis: A Technical Outlook

In Brief

  • Cardano price has been declining since December 14, 2023.

  • Weekly RSI indicates a bearish trend for ADA.

  • Daily chart suggests a potential drop to $0.41.

COINTURK NEWS
COINTURK NEWS 1 year ago
Share
SHARE

Cardano price has been falling since December 14, 2023, creating a lower peak on December 29. Cardano recently fell below a significant horizontal support area, which is now acting as resistance. So, what are the possible chart scenarios for ADA in the coming period? We examine with chart analyses and key levels.

Contents
Cardano Weekly Chart AnalysisCardano Daily Chart Analysis

Cardano Weekly Chart Analysis

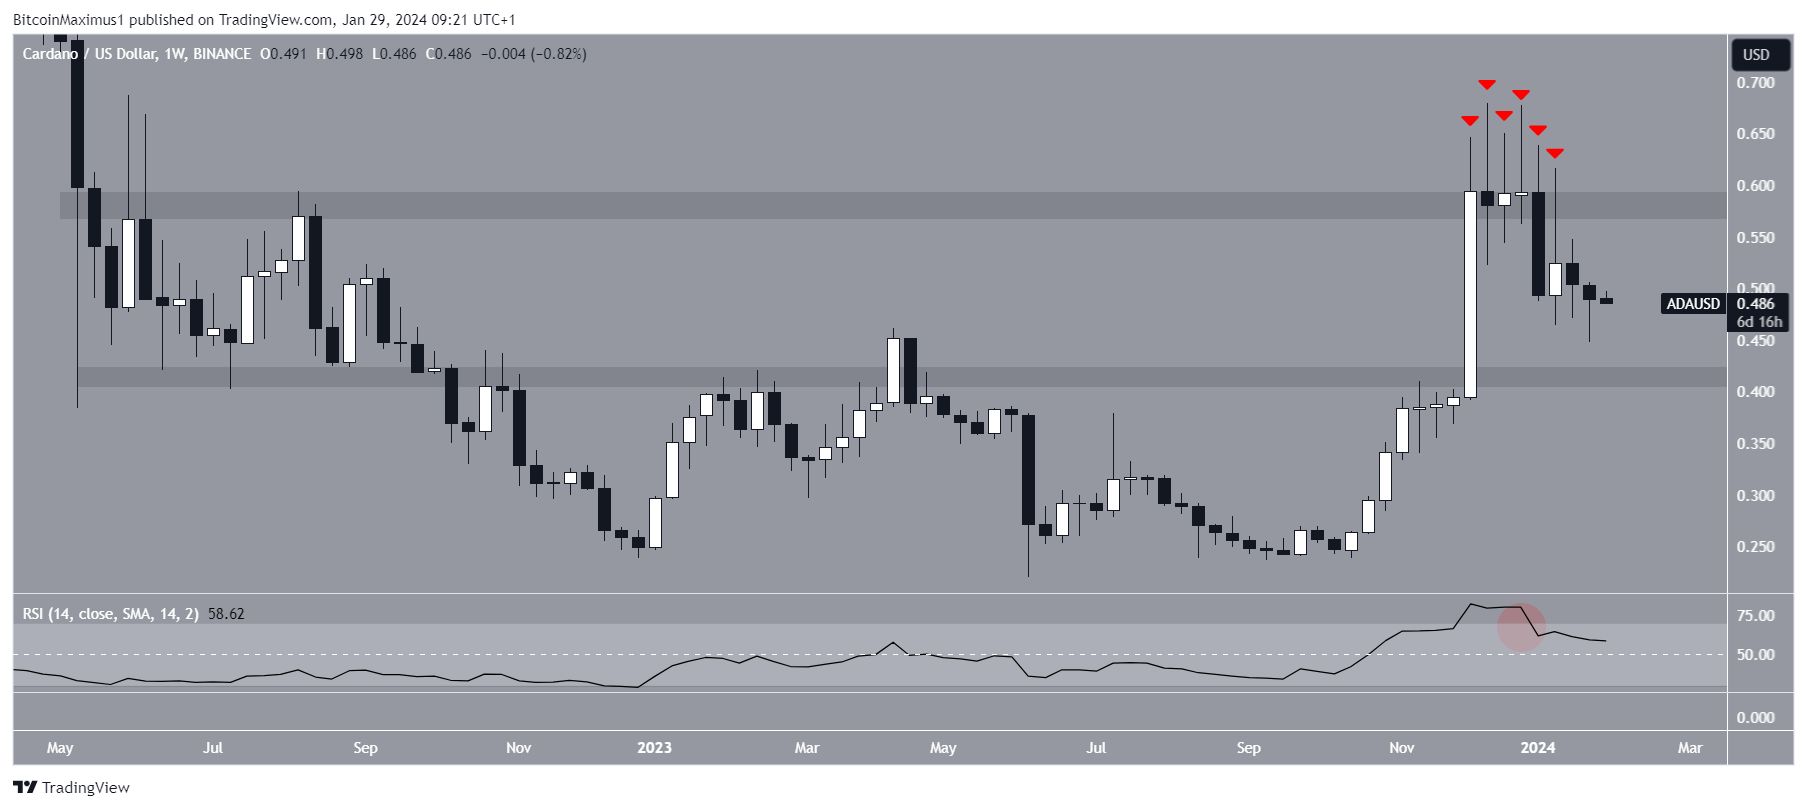
The technical analysis of the weekly chart shows that the ADA price has been rapidly rising since October 2023. However, despite numerous attempts, it failed to break out from a critical horizontal resistance area that has been in place since May 2022. ADA formed six consecutive long upper wicks (red symbols), which are considered signs of selling pressure. It was followed by a sharp downward movement in January 2024. ADA price is currently approaching the previous breakout level.

The Weekly Relative Strength Index (RSI) shows a downward trend. Investors use the RSI level as a momentum indicator to assess whether a market asset is overbought or oversold and whether an asset might be accumulated or sold off.

If the RSI value is above 50 and the trend is upward, the bulls are still at an advantage, but if the value is below 50, the opposite is true. The indicator had dropped below 70 (red circle) at the time of writing and is declining, both signs of a bearish trend.

Cardano Daily Chart Analysis

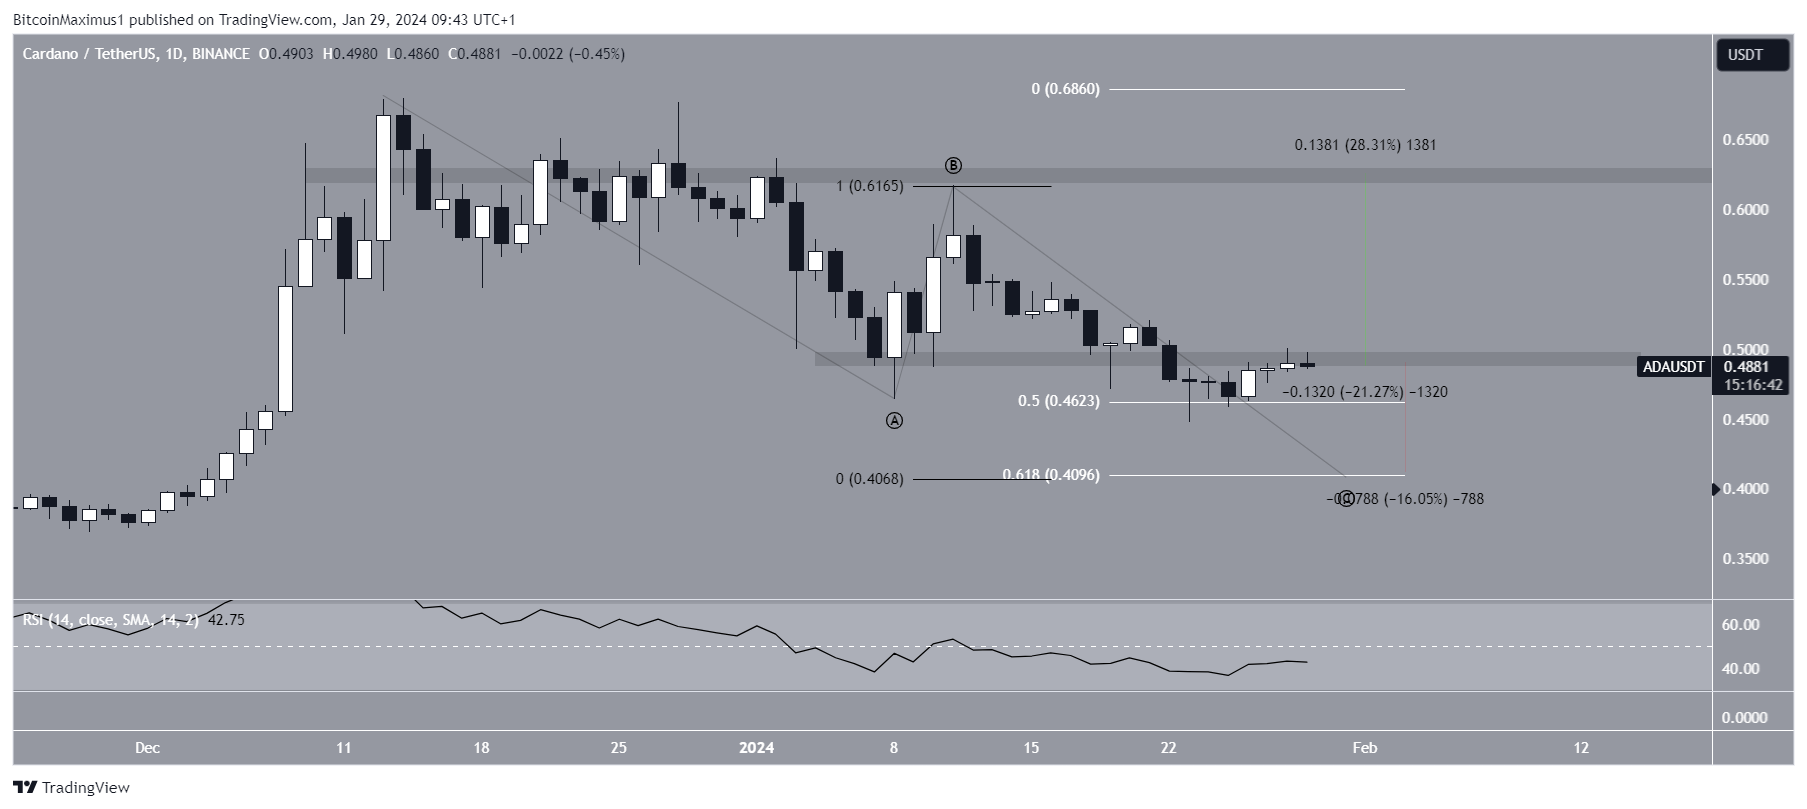
The technical analysis of the daily timeframe predicts a bearish ADA trend due to price action, RSI, and the number of bars. Elliott Wave theory involves the analysis of repeating long-term price patterns and investor psychology to determine the direction of a trend. The most likely scenario shows that ADA is in the C wave of an A-B-C corrective structure. Assigning a 1:1 ratio to the A:C waves leads to a low level of $0.41, aligning with the 0.618 Fib retracement support level (white).

Price action shows that ADA confirmed the $0.50 area as resistance after breaking below it. This is a common retest following such breakouts. Lastly, the daily RSI is below 50 and declining, both signs of a bearish trend.

If the downward movement continues, ADA could retreat to the $0.41 level, which is the 0.618 Fib retracement support level, representing a 16% decrease. Despite this bearish trend prediction, reclaiming $0.50 could trigger an approximate 30% increase to the next resistance at $0.63.

You can follow our news on Telegram, Facebook, Twitter & Coinmarketcap
Disclaimer: The information contained in this article does not constitute investment advice. Investors should be aware that cryptocurrencies carry high volatility and therefore risk, and should conduct their own research.

You Might Also Like

Cardano Excels with Impressive Surge: Transactions and Investor Interest Soar

Cardano Rises Above Challenges to Establish Strong Ground

Cardano Aims to Rise Past USDC in Market Value

Cardano Surges as Bullish Patterns Signal Growth

Cardano Price Rises as Investors Anticipate Psychological Threshold

COINTURK NEWS 29 January, 2024 - 3:16 pm 29 January, 2024 - 3:16 pm
Share This Article
Facebook Twitter
Share
Previous Article Manta Network’s Native Asset MANTA Soars After Launch
Next Article Final Hours for the Optimism Token Unlock Event
Leave a comment

Leave a Reply Cancel reply

Your email address will not be published. Required fields are marked *

This site uses Akismet to reduce spam. Learn how your comment data is processed.

Stay Connected

8.1k Like
21.1k Follow
1.1k Follow

Latest News

Trump Shakes Markets with Trade Tariffs, Court Deals a Setback
Economy
Bitcoin Prices Could Surge to $160,000, Predicts Analyst Dave the Wave
Bitcoin (BTC)
Trump Media Fuels Market Frenzy with Massive Bitcoin Acquisition
Ripple (XRP)
Fed Guards Interest Rate Cuts as Economic Uncertainty Looms
Economy
//

COINTURK was launched in March 2014 by a group of technology enthusiasts who believe that Bitcoin will be as important as the internet in the world of the future thanks to the amazing technology underlying it.

CRYPTOCURRENCY LIVE PRICES

  • Bitcoin (BTC) Live Price
  • Ethereum (ETH) Live Price
  • Ripple (XRP) Live Price
  • Solana (SOL) Live Price
  • Dogecoin (DOGE) Live Price
  • Cardano (ADA) Live Price
  • Chainlink (LINK) Live Price

OUR PARTNERS

  • COINMARKETCAP
  • COINGECKO
  • BITCOINHABER
  • BH NEWS
  • 21MILYON
  • NEWSLINKER

OUR COMPANY

  • About Us
  • Cookie Policy
  • Advertising
  • Contact
COINTURK NEWSCOINTURK NEWS
Follow US
© 2025 BLOCKCHAIN Information Technologies. >> COINTURK NEWS
Powered by LK SOFTWARE
Welcome Back!

Sign in to your account

Lost your password?