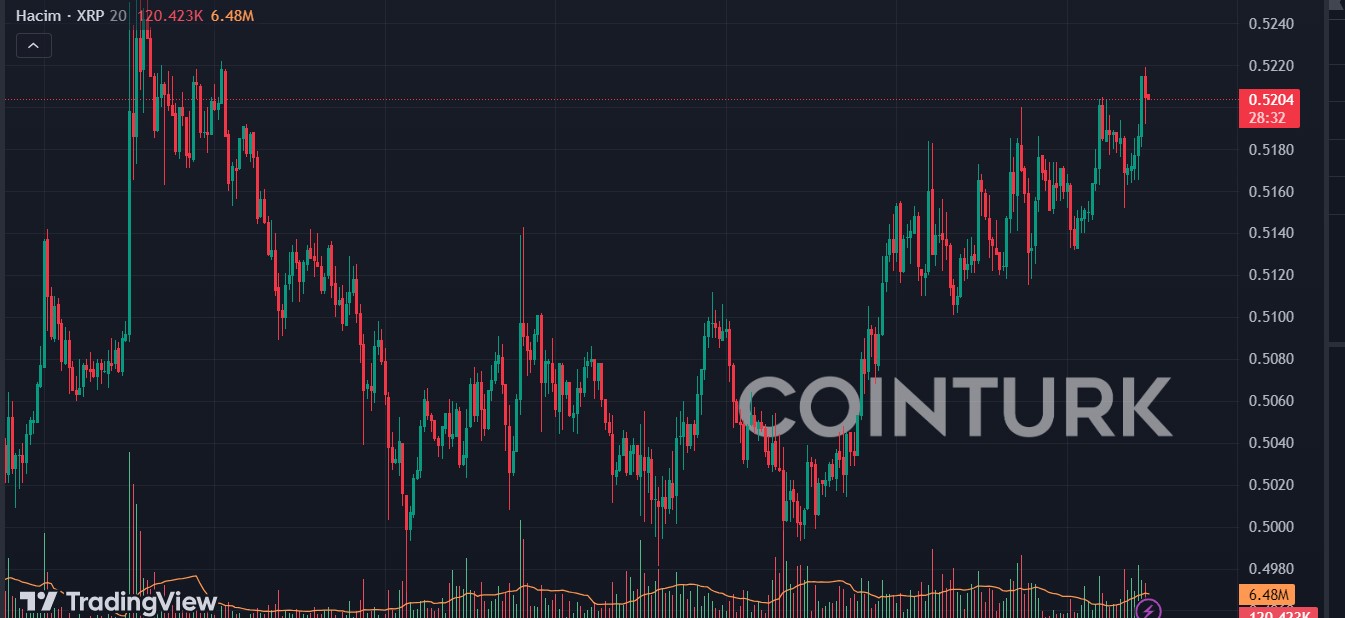
Ripple (XRP) technical indicators, according to experts, indicate the formation of a long-awaited higher peak that could signal the first steps towards a bullish market direction for the cryptocurrency.
Ripple’s Critical Formation
As investors watch the rise towards the $0.56 resistance level, expectations are growing. The latest chart patterns for XRP could show promising signs of a shift from a downtrend to an uptrend. A key factor supporting this view is the potential prevention of the “death cross” event, where long-term moving averages cross above short-term averages, indicating sales. Instead, XRP’s EMAs are showing stability and preparing the ground for an upward movement without the shadow of a bearish crossover. Looking at specific support and resistance levels, XRP can currently find solid support at the $0.51 level. The continuation of this level could create a solid foundation on which the token’s value can be built.
However, the volatile nature of cryptocurrency markets requires consideration of a potential downside scenario. If XRP cannot maintain its support level, a fall below $0.51 could trigger sales and lead to further downward pressure. In such a case, the next support around $0.50 could be critically important to prevent a steeper decline. The chart does not show any urgent extraordinary factors beyond the usual indicators, but the current trend of the market, influenced by global economic factors and sentiment within the crypto community, could play a very important role in determining XRP’s direction.

The Bitcoin Effect on Ripple
Bitcoin is on the rise, showing a liveliness reminiscent of the excitement surrounding rumors of the approval of a Bitcoin ETF, signaling a move away from speculative fluctuations and potentially indicating sustainable growth. The king of cryptocurrencies has shattered the resistance levels that previously capped its price, surpassing the critical $44,000 threshold. This level not only indicates a shift from resistance to support but also lays the groundwork for the next psychological barrier climb towards $47,000. If the bulls maintain control, progress towards $50,000 could be imminent, which would strengthen the bullish narrative in the crypto world.
Bitcoin’s resilience could support a longer period of value gain, fueling market enthusiasm. One of the standout features on the chart is Bitcoin’s successful crossing of the moving averages around $40,000, which has increased the asset’s upward momentum. If Bitcoin cannot sustain its newfound support and succumbs to selling, we could see a pullback towards the $42,000 support level. A drop below this base could trigger a downtrend, but the strong support at $40,000 could serve as an important buffer against a more serious decline.

 Türkçe
 Español


