In the field of cryptocurrency trading, understanding the nuances of Bitcoin (BTC) trends has become very important for making informed decisions. Analyst Skew examined the daily and 4-hour charts today to provide insights into Bitcoin’s potential market movements. Let’s look at the analyst’s comments.
BTC’s Daily Chart Analysis
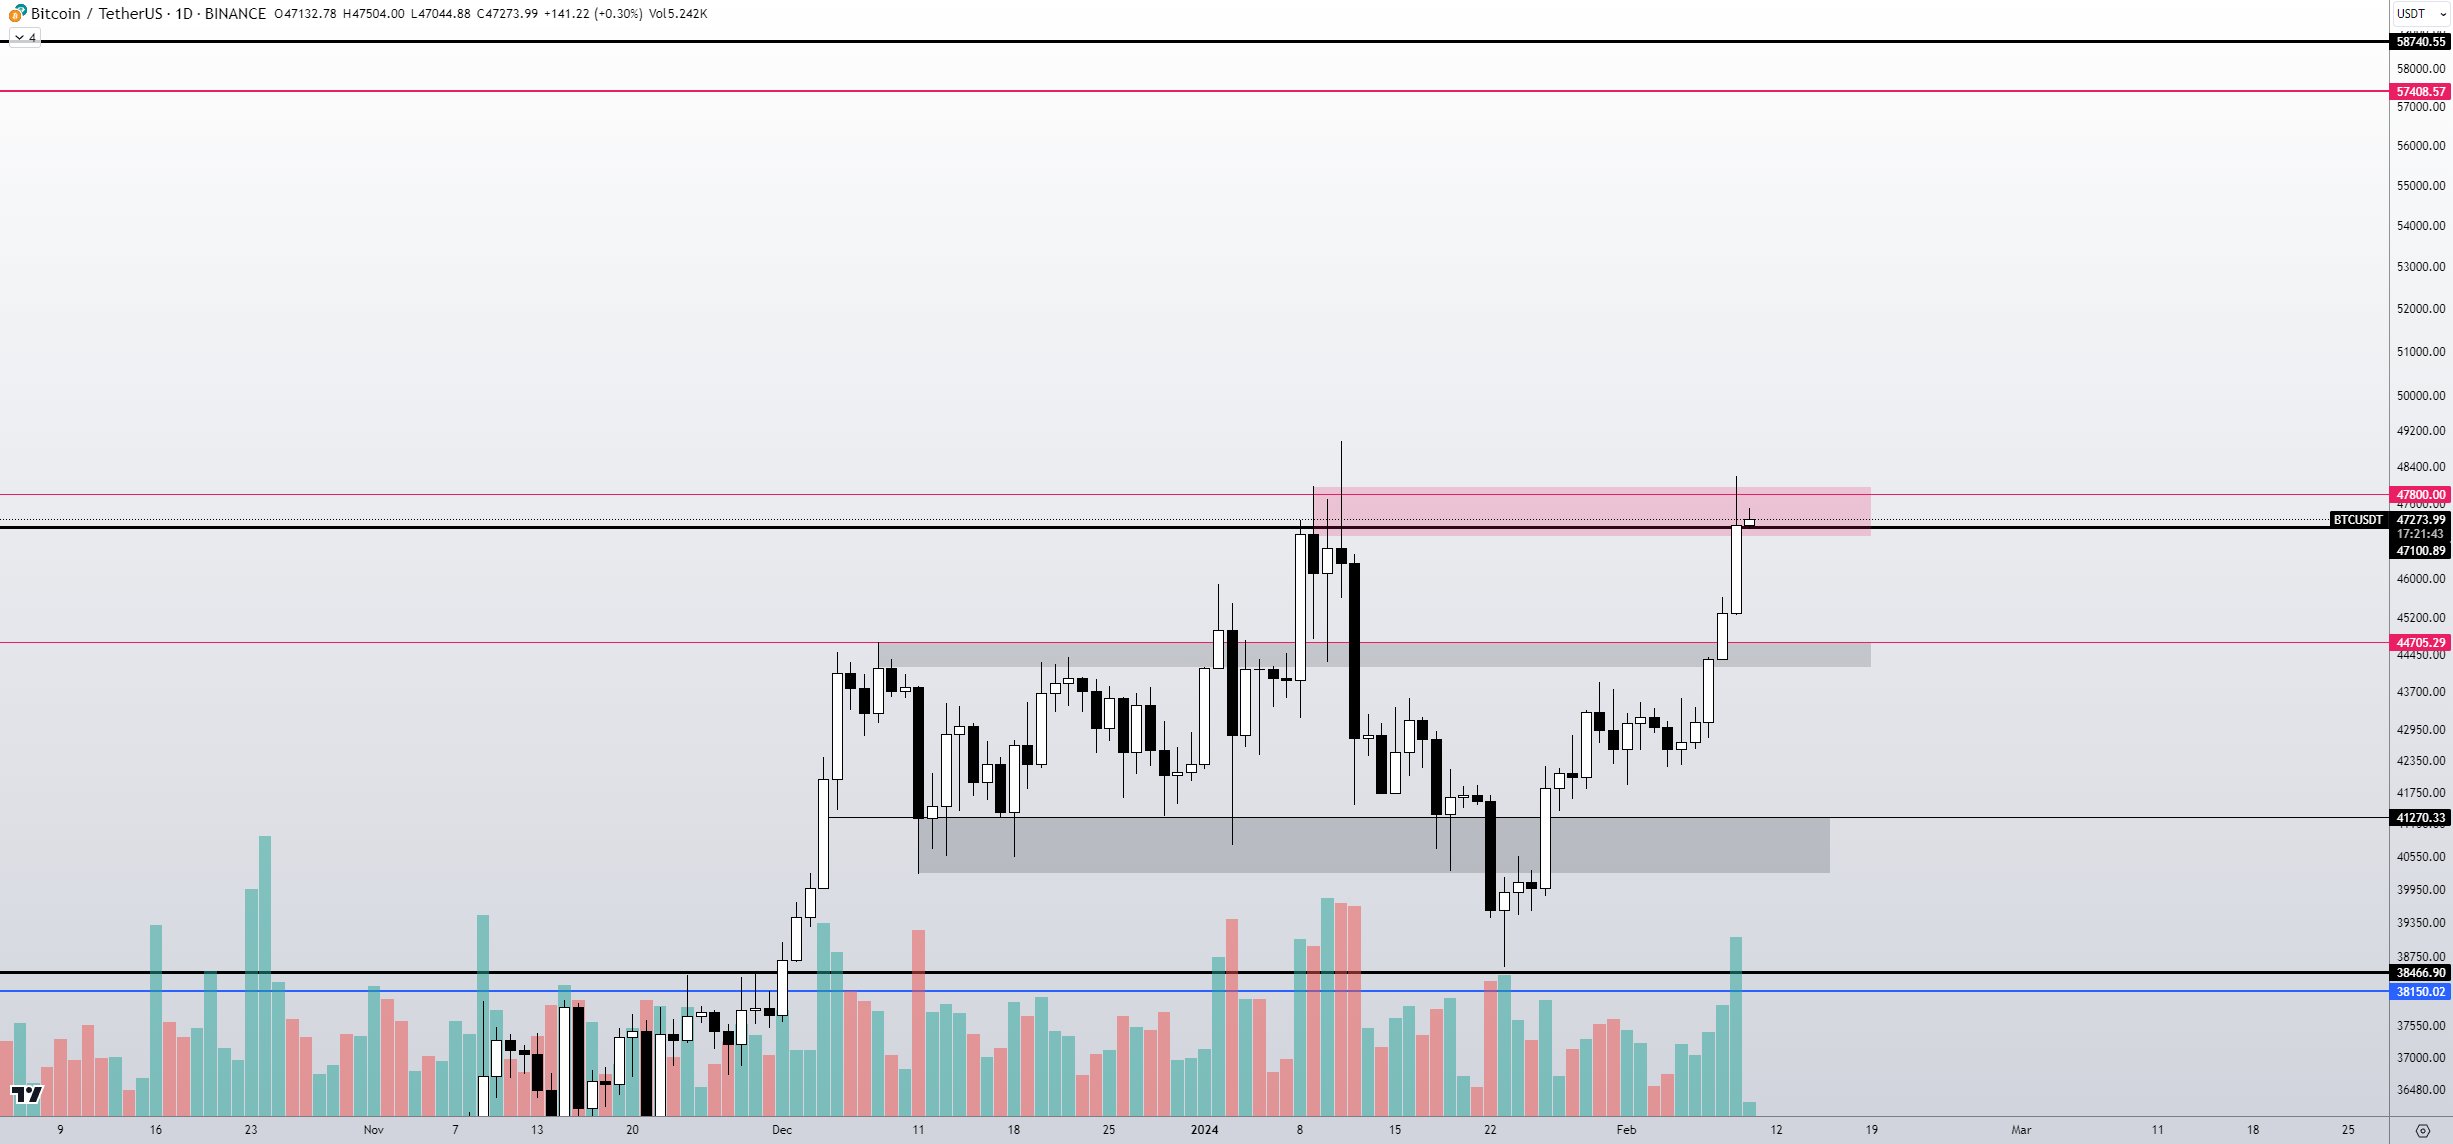
The daily structure looks promising, but its fate depends on the nature of consolidation and the weekly close. However, the analyst advises caution as this points to a high time frame (HTF) breakout area.

It would be wise to wait for confirmation on the 4-hour charts before taking any position. Particularly, increasing buying volume in supply zones indicates the strength behind the prevailing trend. Nonetheless, according to the analyst, there is an ongoing need to surpass supply levels to facilitate a breakout.
BTC’s 4-Hour Chart Analysis
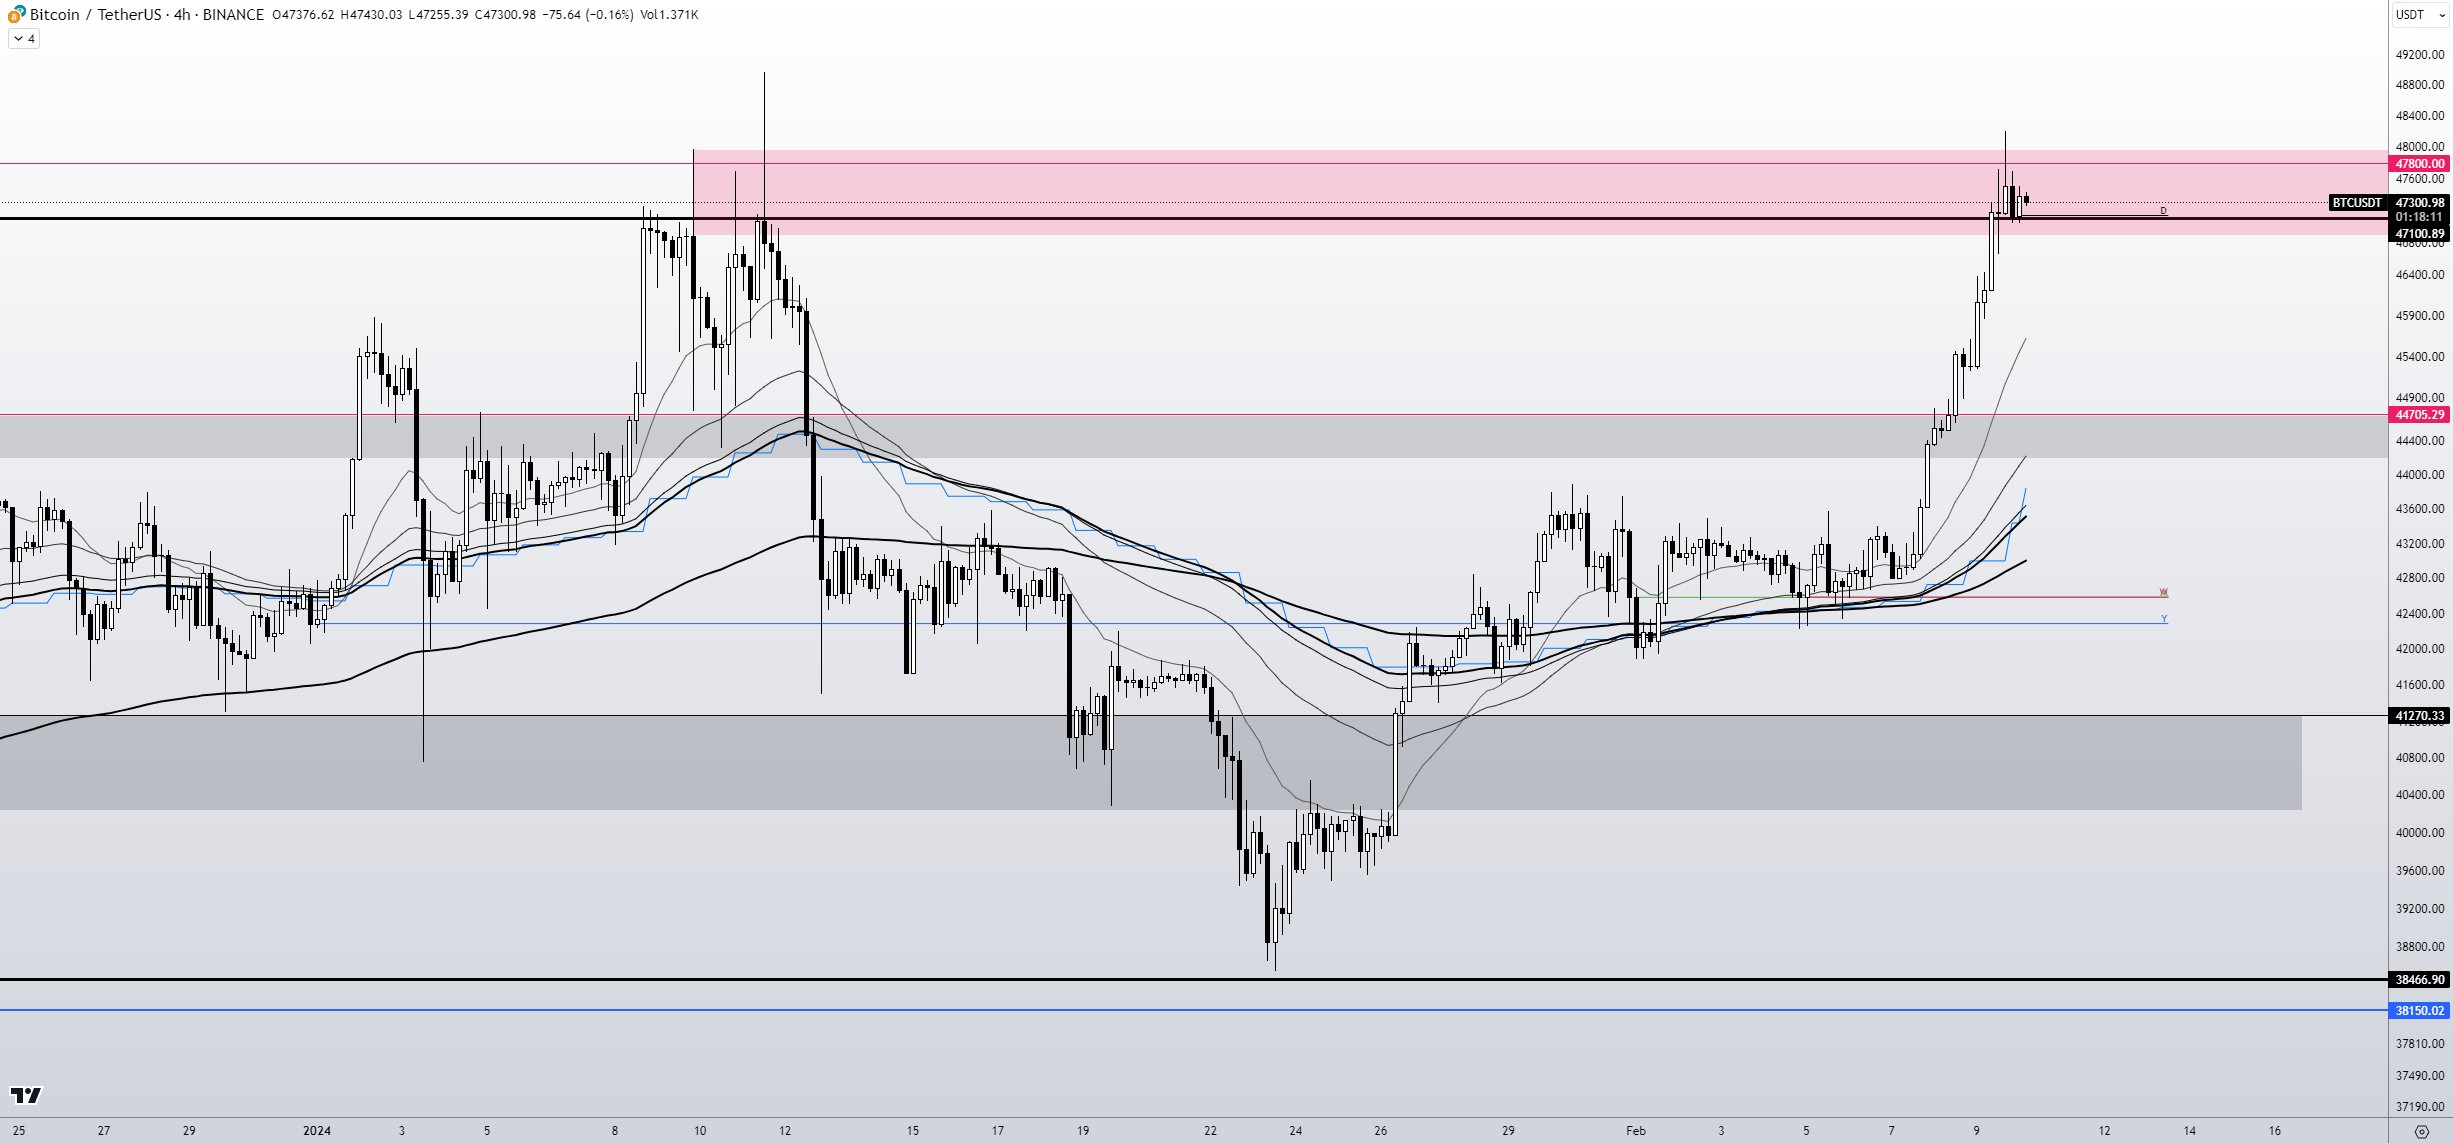
The 4-hour chart is still developing after an impulse move towards the supply zone. A strong 4-hour close above the supply wick around $48,000 is expected for the bullish momentum to continue.

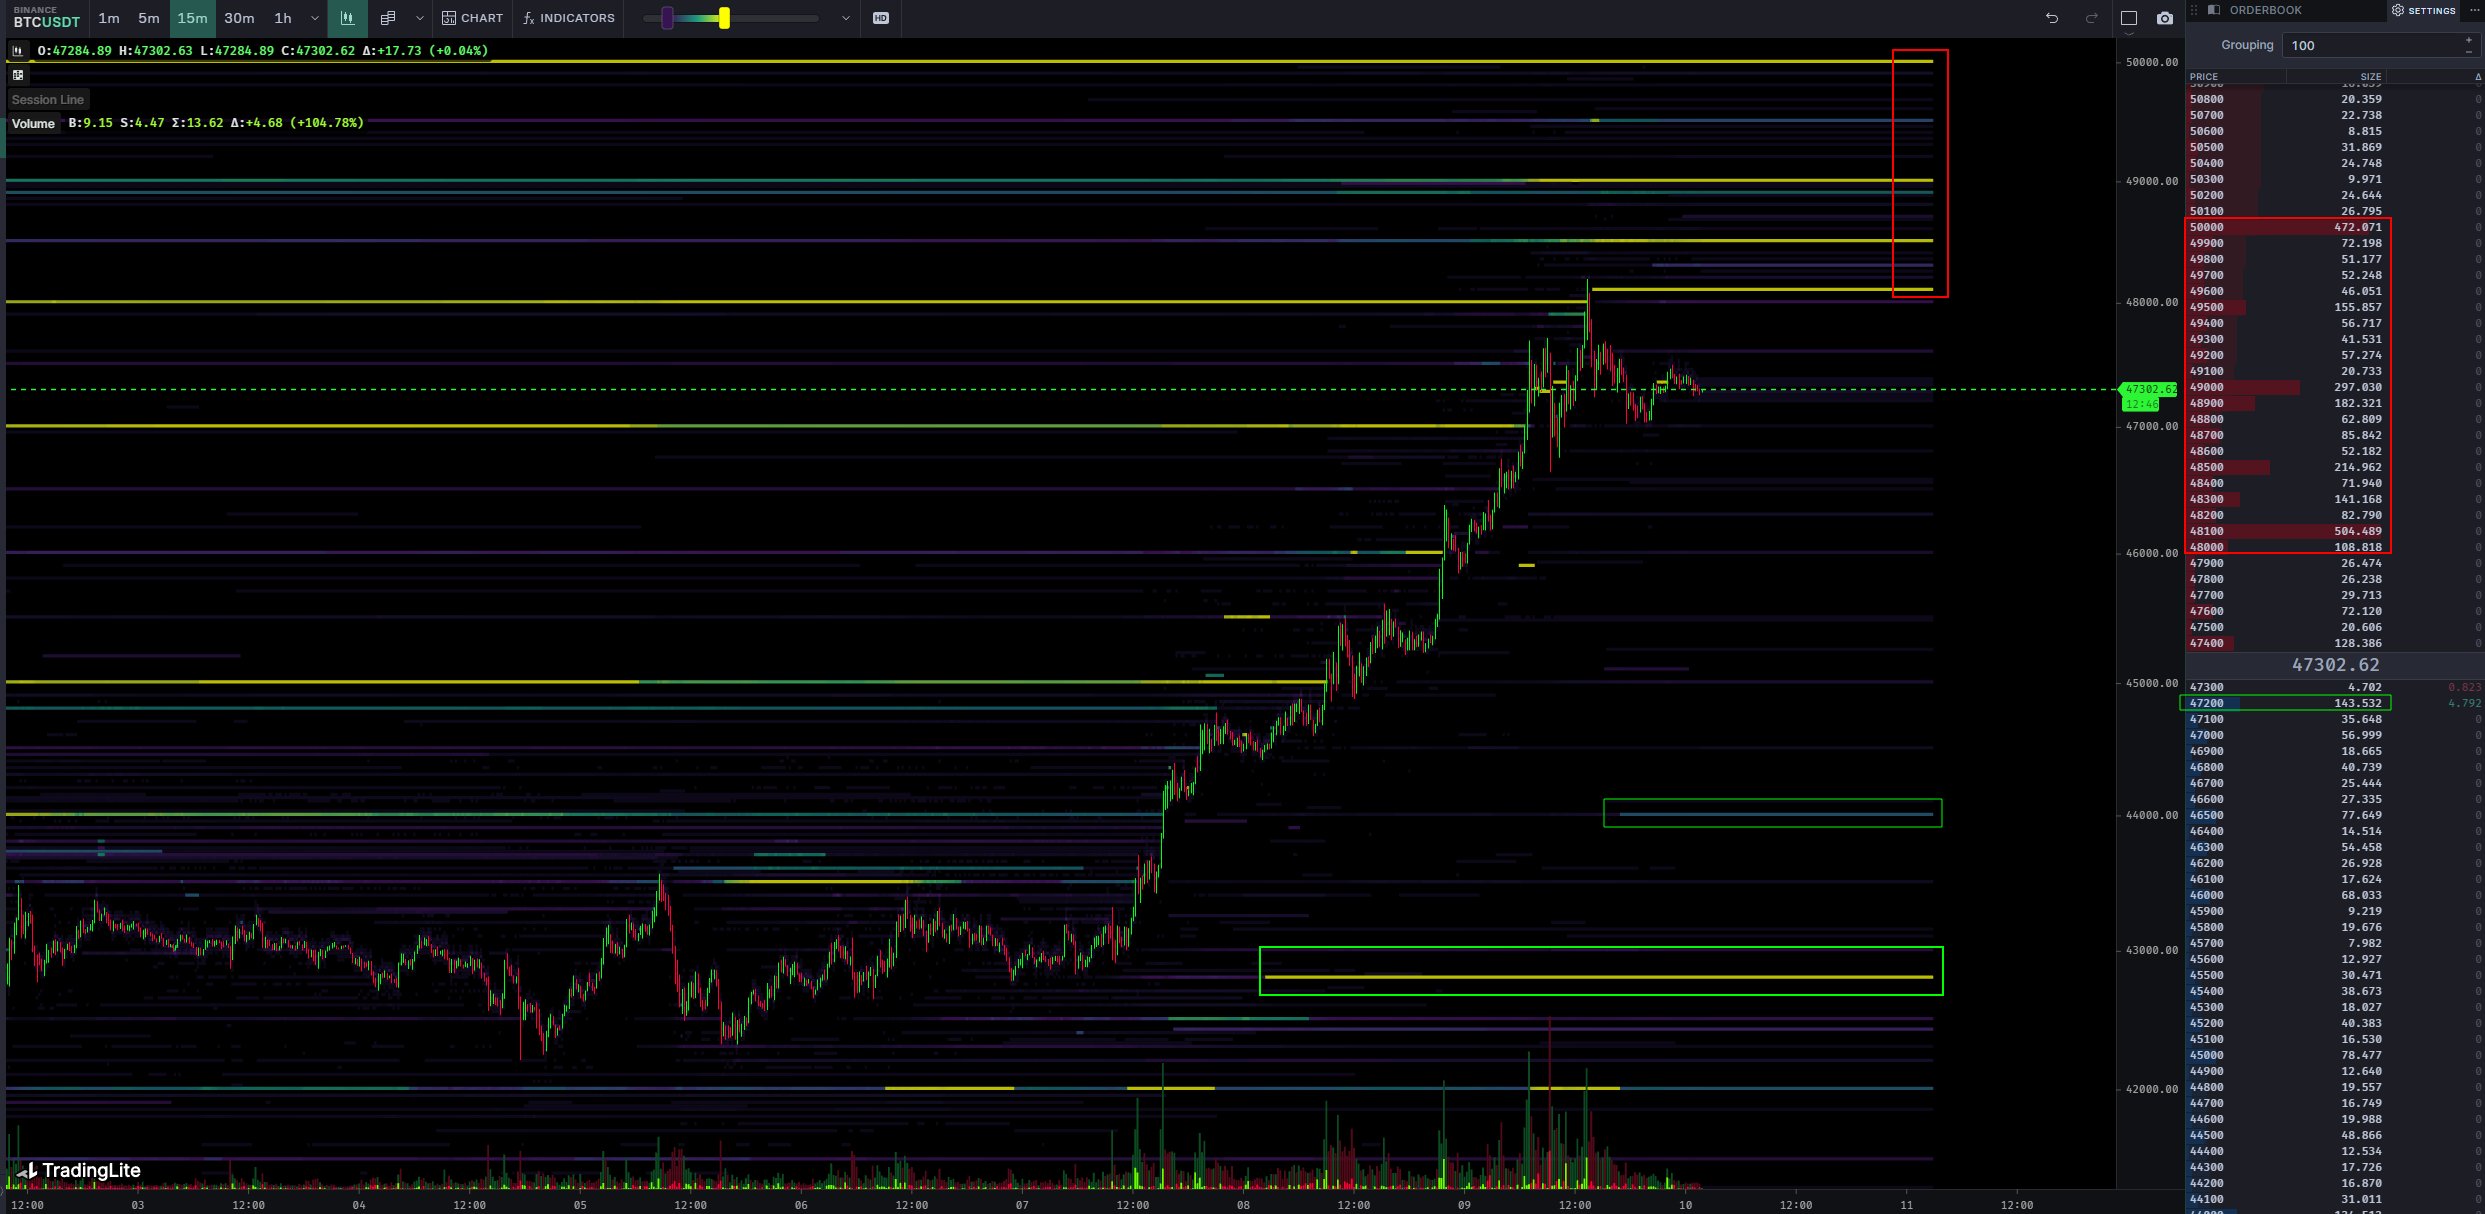
On the other hand, in the Binance spot market, the recent breach and quick replenishment of the $48,000 demand wall indicates significant supply in the $48,000-$50,000 range. Monitoring pullbacks for ongoing absorption by sellers and buyer flow according to the dominant momentum and trend is recommended.

Analysis of BTC’s Total CVDs and Delta
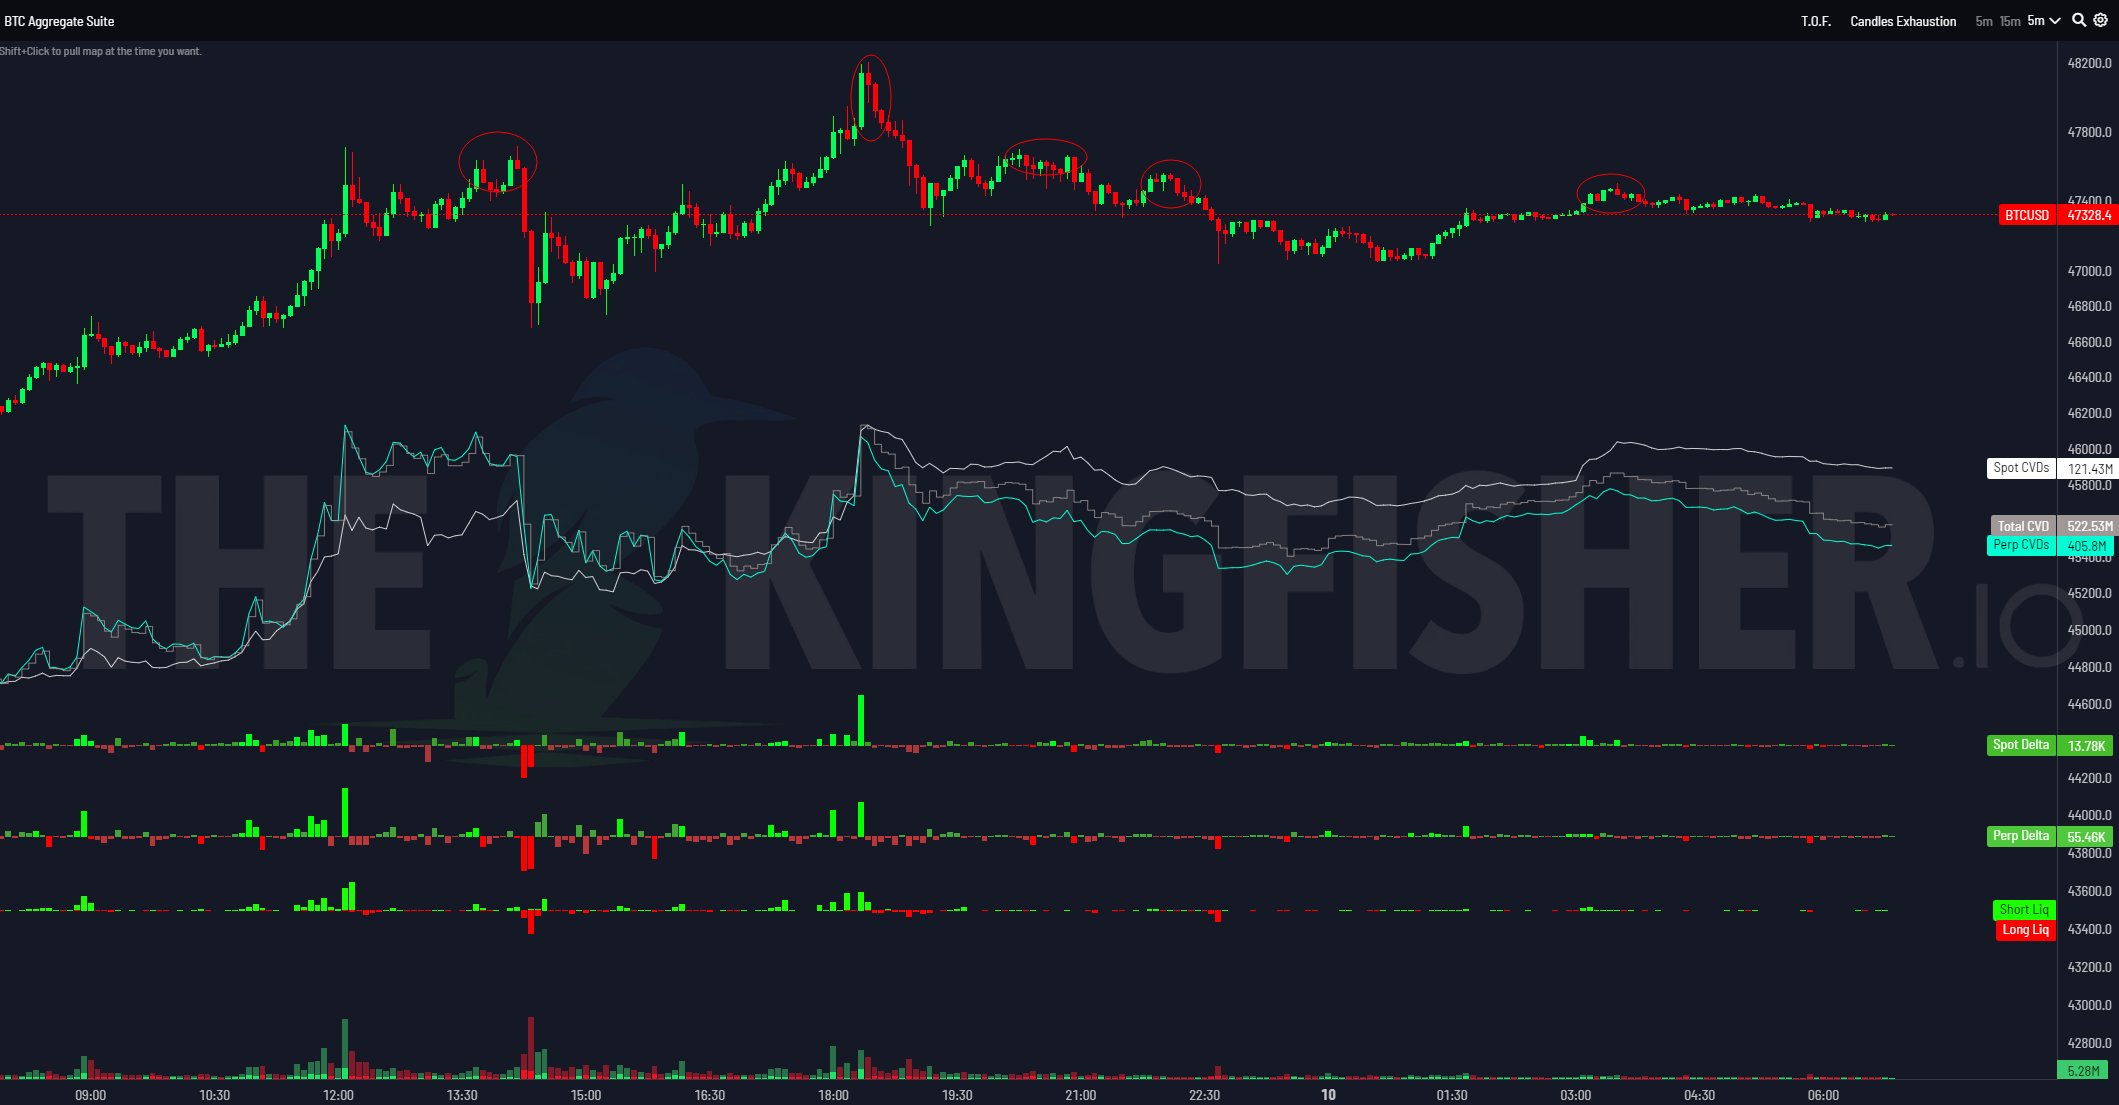
Observations from BTC’s total Cumulative Volume Delta (CVD) and Delta reveal signs of limit sell orders during buyer-driven price increases in lower time frames (LTF). This supply convergence is particularly noticeable during the rise to $48,000, where the market delta increased against the price, signaling that buyers could not sustain higher levels.
A breakout is dependent on a change in flow characterized by increased limit buys and buyer offers, reflecting higher market valuations. The presence of perpetual contracts adds significant volatility to price dynamics, influenced by the flexibility of positions in parallel with price movements.

Navigating the complex terrain of BTC trading necessitates deciphering signals across various time frames. While daily structures provide an idea about overarching trends, the detail level of 4-hour charts helps identify critical levels for potential breakouts or reversals.
Moreover, being vigilant in monitoring market dynamics such as volume patterns and order book data is indispensable for making informed trading decisions in the continuously evolving cryptocurrency environment.

 Türkçe
 Español


