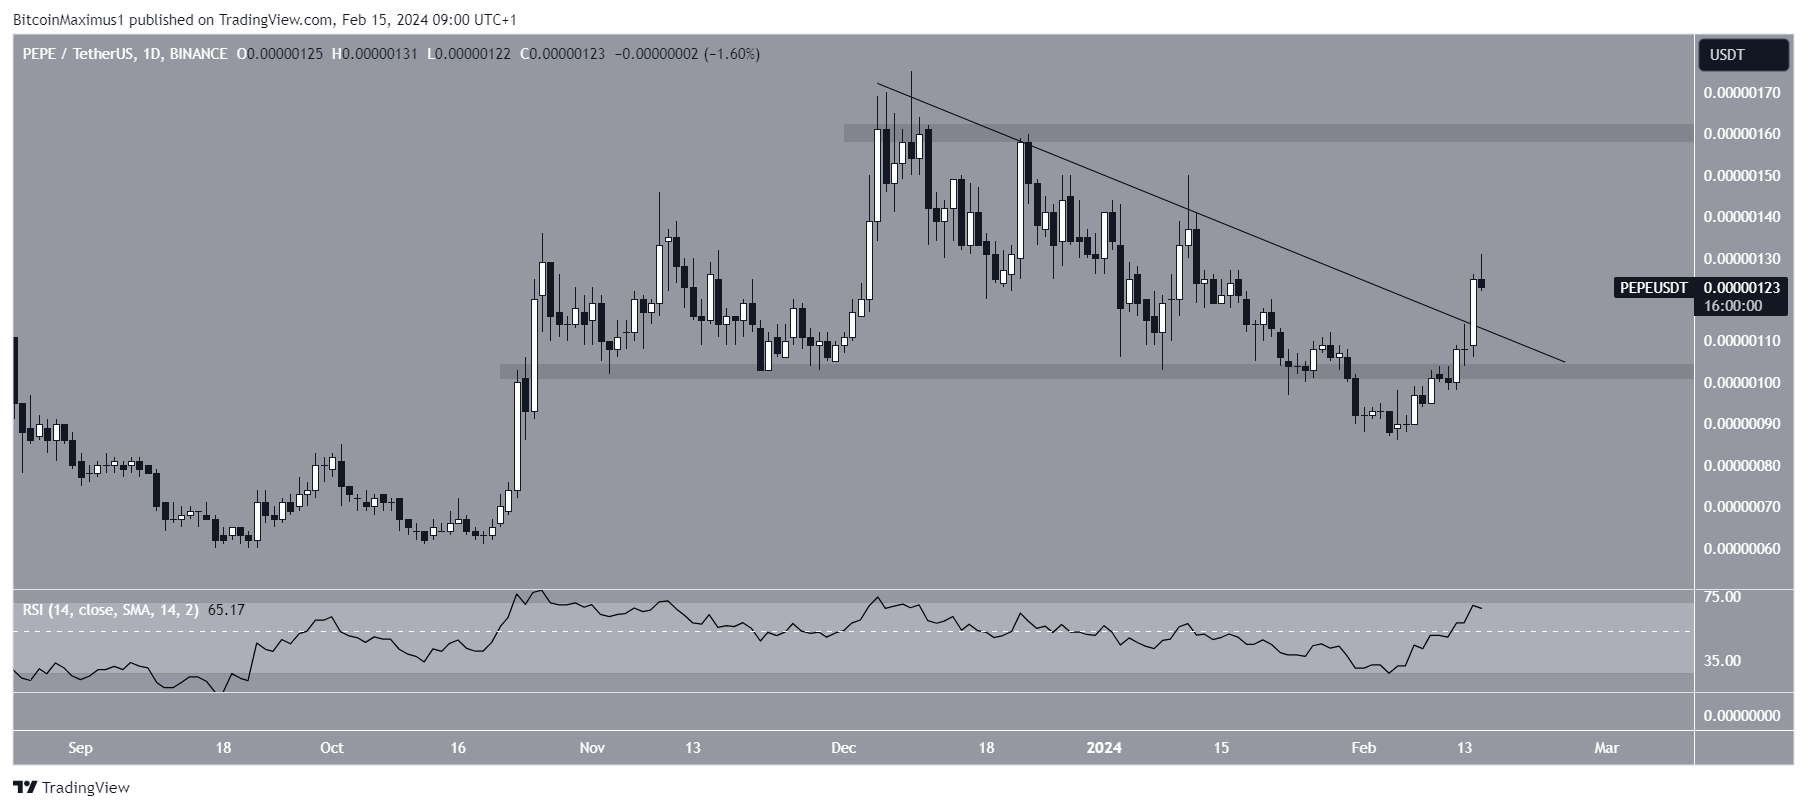
PEPE price has been on the rise since February, breaking through horizontal and diagonal resistance levels. Is PEPE starting a new uptrend that will take it to new peaks, or is this just a relief rally?
PEPE Price Analysis
Experts’ technical analysis of the daily time frame indicates that the PEPE price fell below a decreasing resistance trend line that had been in place since December 2023. The downward movement led to a drop to $0.00000086 on February 5, 2024. Since then, PEPE has increased in value and reclaimed the $0.00000100 horizontal area. The cryptocurrency price also broke out from a descending resistance trend line, reaching $0.00000131 today.
According to analysts, the daily Relative Strength Index (RSI) is showing signs of an uptrend. Market investors use the RSI as a momentum indicator to determine overbought or oversold conditions and decide whether a token is being accumulated or sold off. Readings above 50 and an upward trend suggest that bulls are still in a favorable position, while readings below 50 indicate the opposite.

PEPE Future Forecast
The indicator is above 50 and rising, which could signal an uptrend. A closer look at the Elliott wave count also suggests that the upward movement will continue. Technical analysts use Elliott wave theory to identify repeating long-term price patterns and investor psychology, which helps them determine the direction of a trend. The most likely wave count indicates that the PEPE price has completed a five-wave upward movement followed by an ABC correction.
If the count is correct, PEPE may have started a new upward movement. Matching both increases in length could lead to a high of $0.00000200, over 60% above the current price. Despite this upward PEPE price forecast, a close below $0.00000100 could invalidate the bullish count. Then the cryptocurrency could drop by 50% to the nearest support at $0.00000060.


