COINTURK NEWSCOINTURK NEWSCOINTURK NEWS
  • Real-Time News Feed
  • Bitcoin
  • Altcoin
  • Ethereum
  • Technology News
  • Advertise
  • Contact
  • TURTURTUR
  • ESESES
Search
© 2024 COINTURK NEWS. All Rights Reserved.
Reading: Polygon’s Price Reaches Long-Term Resistance: Can MATIC Hit $1?
Share
Languages
  • TürkçeTürkçe
  • EspañolEspañol
Font ResizerAa
COINTURK NEWSCOINTURK NEWS
Font ResizerAa
Search
  • Real-Time News Feed
  • Bitcoin
  • Altcoin
  • Ethereum
  • Technology News
  • Advertise
  • Contact
  • TURTURTUR
  • ESESES
Follow US
© 2025 BLOCKCHAIN Information Technologies. >> COINTURK NEWS
Powered by LK SOFTWARE
COINTURK NEWS > Polygon (MATIC) > Polygon’s Price Reaches Long-Term Resistance: Can MATIC Hit $1?
Polygon (MATIC)

Polygon’s Price Reaches Long-Term Resistance: Can MATIC Hit $1?

In Brief

  • Polygon (MATIC) price hits long-term descending resistance line.

  • Weekly RSI indicates a bullish signal for MATIC's market momentum.

  • Daily chart analysis suggests a potential upward movement for MATIC.

COINTURK NEWS
COINTURK NEWS 1 year ago
Share
SHARE

Polygon price has reached the long-term descending resistance line that has been in place for about 800 days, and MATIC has also hit the top of its short-term horizontal range. Will MATIC be able to reach $1 following a resistance breakout? Technical analysis on the weekly timeframe shows that the MATIC price has been under the long-term descending resistance line since the beginning of 2022.

Contents
Weekly MATIC Chart AnalysisDaily MATIC Chart Analysis

Weekly MATIC Chart Analysis

This decline led to a low of $0.32 in June 2022 before MATIC began an upward movement. The resistance trend line has been tested and confirmed four times, most recently this week. This situation has been ongoing for approximately 800 days. Cryptocurrency investor CryptoFaibik believes that the MATIC price could increase by more than 600% once it breaks out from this long-term resistance.

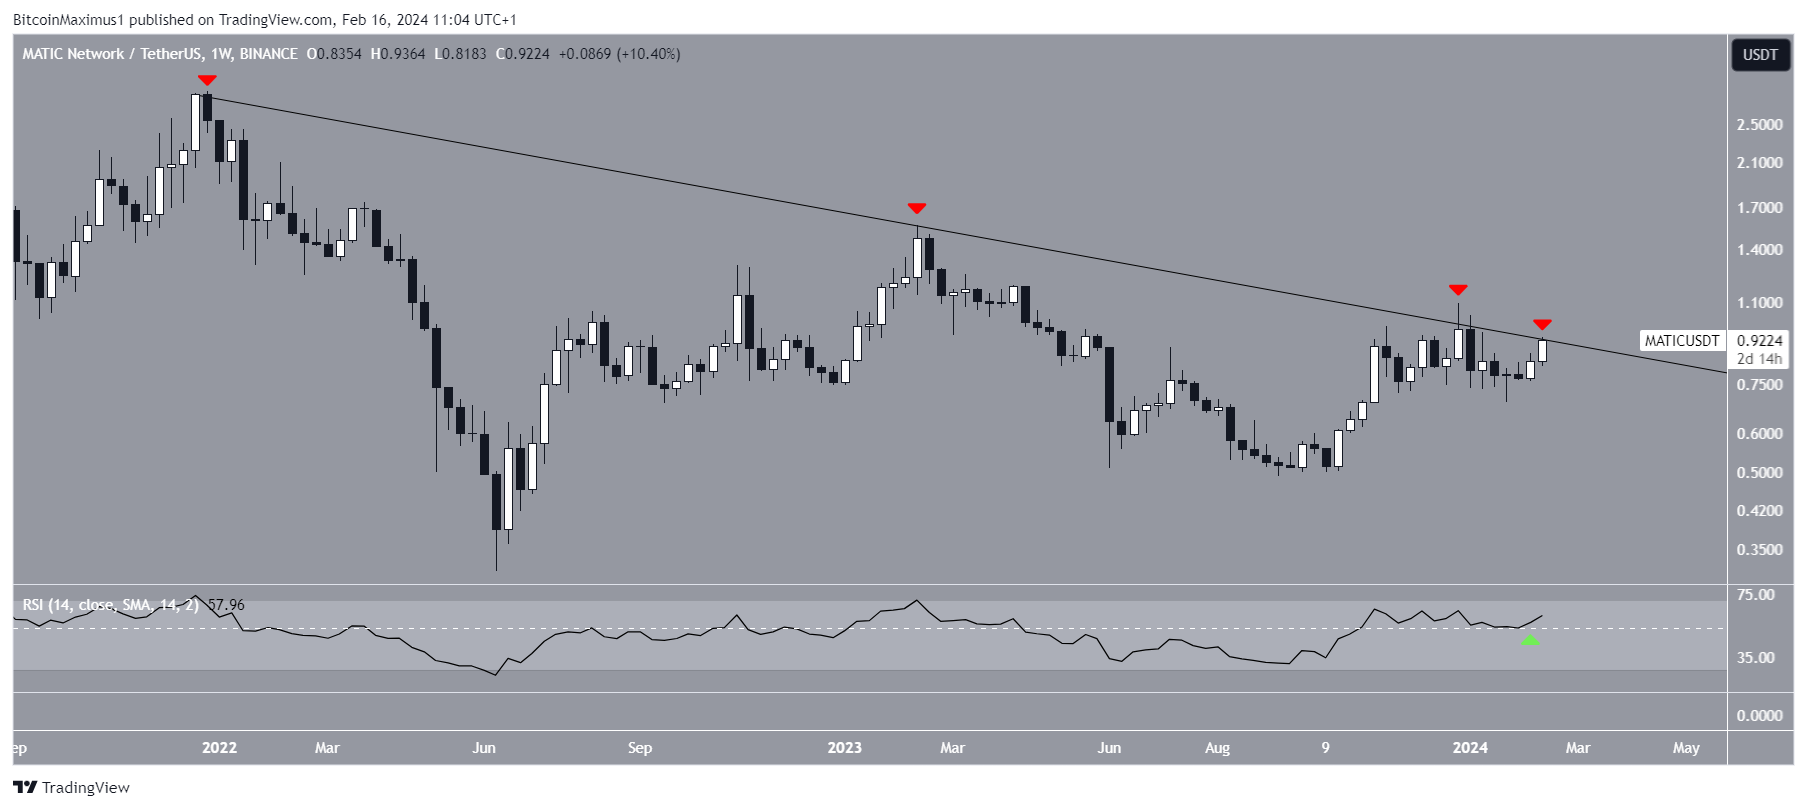
The Weekly Relative Strength Index (RSI) is giving a bullish signal. Investors continue to use the RSI level as an important indicator of momentum when assessing market conditions.

If the RSI value is above 50 and the trend is upward, it is advantageous for the bulls, but if the value is below 50, the opposite holds true. The indicator has risen to 50 (green icon) and is moving upward. Both of these developments are signs of a bullish trend.

Daily MATIC Chart Analysis

Daily chart analysis shows a bullish outlook due to price action, RSI readings, and wave count. The price movement indicates that MATIC has been increasing since its bounce from the low range on January 23, reaching a high of $0.93. The daily RSI level supports this increase as it is above 50 and moving upwards. Finally, the wave count supports the ongoing breakout. Elliott Wave theory involves analyzing recurring long-term price patterns and investor psychology to determine the direction of a trend.

The most likely assumption indicates that MATIC is in the third wave of a five-wave upward movement. The third wave is often the sharpest of the five and would align with a breakout from the long-term descending resistance trend line. Giving a 1:1 ratio to the first and third waves would lead to a target of $1.54 for the current MATIC price, which is over 65% higher.

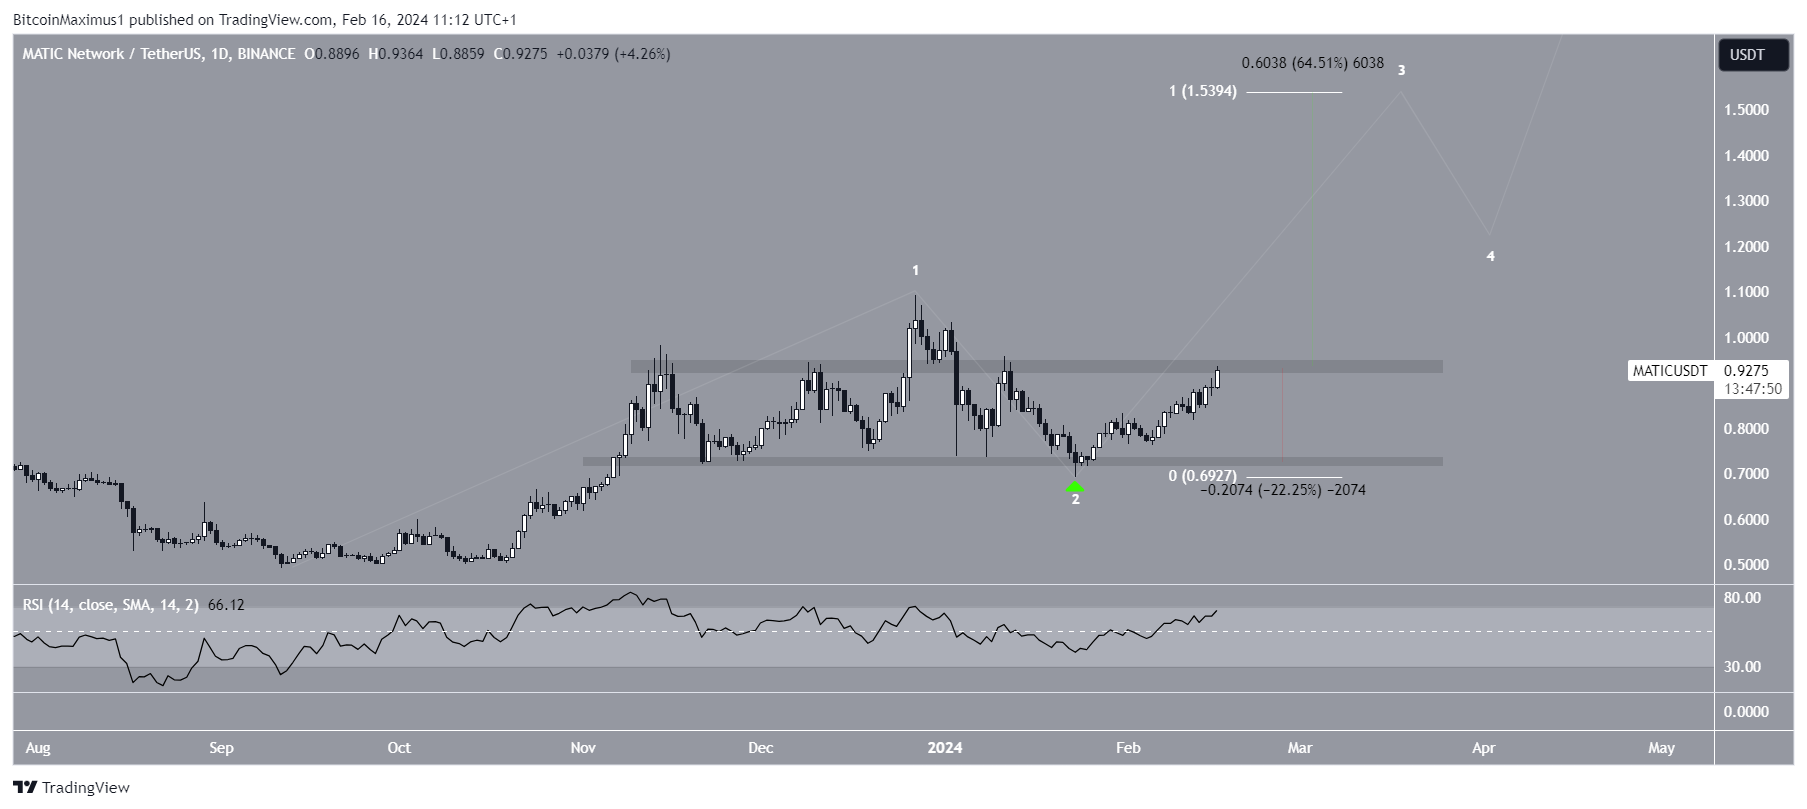
Despite this bullish price prediction for MATIC, failure to break out from the resistance area of $0.93 could trigger a 20% drop to the nearest support at $0.73.

You can follow our news on Telegram, Facebook, Twitter & Coinmarketcap
Disclaimer: The information contained in this article does not constitute investment advice. Investors should be aware that cryptocurrencies carry high volatility and therefore risk, and should conduct their own research.

You Might Also Like

Polygon Launches AggLayer v0.2 Testnet to Enhance Blockchain Interactions

Polygon Community Votes on Liquidity Proposal to Fund Ecosystem Growth

AggLayer Summit Engages Blockchain Leaders in Bangkok

Polygon and Magic Labs Create a New Cross-Chain Network

Polygon Maintains Strong Performance Despite POL Token Price Drop

COINTURK NEWS 16 February, 2024 - 7:52 pm 16 February, 2024 - 7:52 pm
Share This Article
Facebook Twitter
Share
Previous Article Revolut Launches Advanced Crypto Exchange for Seasoned Investors
Next Article What is QuickSwap Coin?
Leave a comment

Leave a Reply Cancel reply

Your email address will not be published. Required fields are marked *

This site uses Akismet to reduce spam. Learn how your comment data is processed.

Stay Connected

8.1k Like
21.1k Follow
1.1k Follow

Latest News

Crypto Demand Surges: Bitcoin ETFs Hit New Highs
Altcoin News
Coinbase Enters S&P 500 Setting a Milestone for Cryptocurrency Acceptance
Coinbase
Cardano Makes Waves with Impressive Price Surge and Market Optimism
Cardano (ADA)
Robinhood Triumphs with a Bold Canada Debut by Acquiring WonderFi
Cryptocurrency Exchanges
//

COINTURK was launched in March 2014 by a group of technology enthusiasts who believe that Bitcoin will be as important as the internet in the world of the future thanks to the amazing technology underlying it.

CRYPTOCURRENCY LIVE PRICES

  • Bitcoin (BTC) Live Price
  • Ethereum (ETH) Live Price
  • Ripple (XRP) Live Price
  • Solana (SOL) Live Price
  • Dogecoin (DOGE) Live Price
  • Cardano (ADA) Live Price
  • Chainlink (LINK) Live Price

OUR PARTNERS

  • COINMARKETCAP
  • COINGECKO
  • BITCOINHABER
  • BH NEWS
  • 21MILYON
  • NEWSLINKER

OUR COMPANY

  • About Us
  • Cookie Policy
  • Advertising
  • Contact
COINTURK NEWSCOINTURK NEWS
Follow US
© 2025 BLOCKCHAIN Information Technologies. >> COINTURK NEWS
Powered by LK SOFTWARE
Welcome Back!

Sign in to your account

Lost your password?