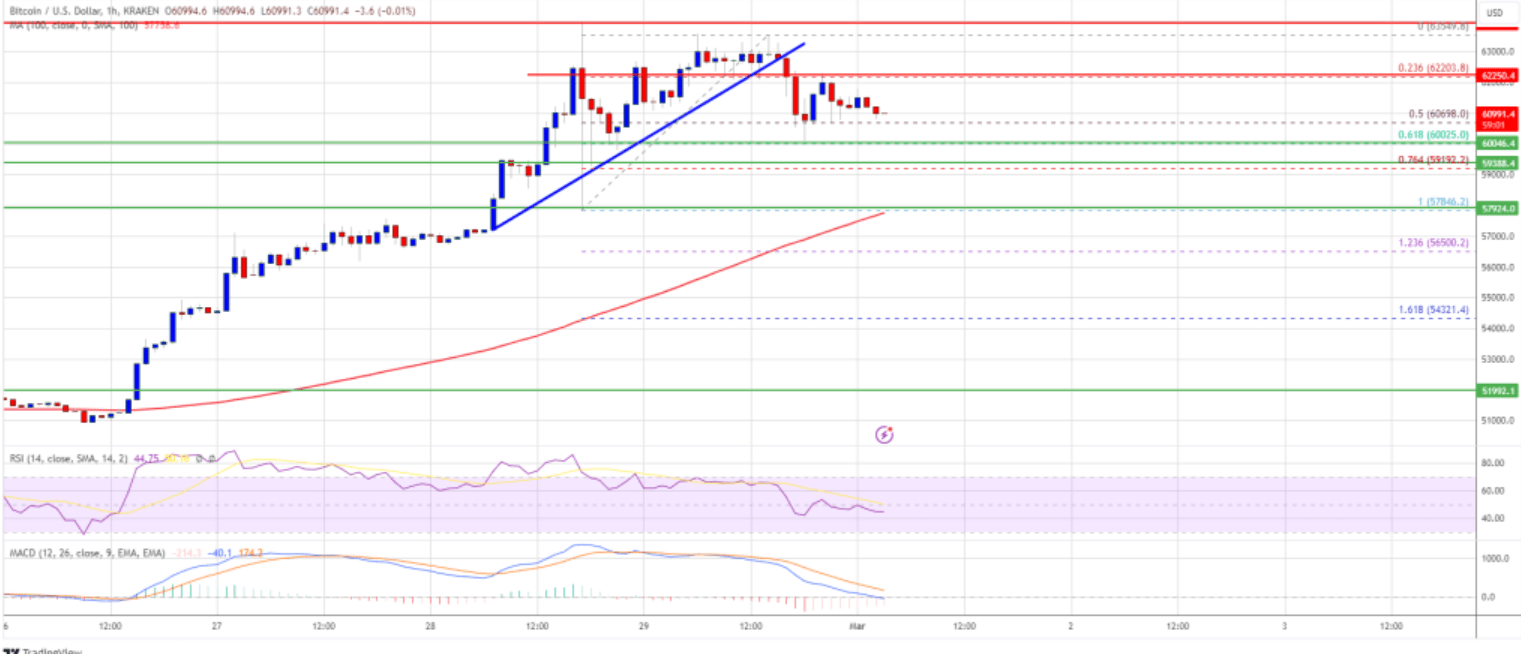
Bitcoin price has begun to correct its gains after the recent rally, retreating from the $64,000 resistance level. BTC is currently seeking strong support near the $59,250 level or the 100-hour Simple Moving Average. However, it is a matter of curiosity how long this correction will last and how far it can go. Therefore, as I mentioned in the title, BTC seems to be resting right now.
Has Bitcoin Price Begun Its Correction Phase?
The recent surge halted as Bitcoin‘s price fell below the $62,250 resistance area. However, the price is still trading above the $60,000 level and the 100-hour Simple Moving Average. A breakdown below the $62,850 support trend line on the hourly chart of the BTC/USD pair has occurred. This development indicates a downward trend in price.
Bitcoin’s price surpassed the $63,200 level, continuing its rally, and tested the $64,000 region. However, a correction movement began before these levels could be sustained, with the highest level of recent weeks forming around $64,000. Nevertheless, the price dropping below the $62,000 support indicates that the correction movement has started.
The correction movement in the Bitcoin price continued above the $62,000 resistance area. However, the price’s failure to reach the resistance at the $62,850 level suggests that the correction could continue. In this case, the next key resistance level could be $62,850, and if the price breaks above this level, a rise towards the $64,000 resistance area could be expected.
Is There a Downtrend in Store for BTC?
A break below the ascending trend line on the hourly chart of the BTC/USD pair indicates that the downtrend is strengthening. The support levels to watch are $60,000 and the $60,698 level, which corresponds to the 50% Fibonacci retracement level.

When examining technical indicators, the hourly MACD is losing momentum and the hourly RSI is below the 50 level. This suggests that the price correction could continue.
The correction movement in Bitcoin’s price is ongoing, and it remains uncertain which direction the price will take in the coming days. However, the support provided by the $60,000 level and the 100-hour Simple Moving Average suggests that the correction could be limited. On the other hand, if the resistance at the $62,850 level is breached, it could be thought that the bulls may regain control. Yet, closures below these levels could signal further declines.

 Türkçe
 Español


