Bitcoin is recovering from its two-month low under $57,000, with a 5.2% increase in the last 24 hours. Data from TradingView shows that Bitcoin’s price rose from a low of $56,551 on May 1st to a high of $62,123 on May 3rd, marking a 9.85% increase. As the crypto markets continue to recover, investors are pondering which levels to watch.
What’s Happening on the Bitcoin Front?
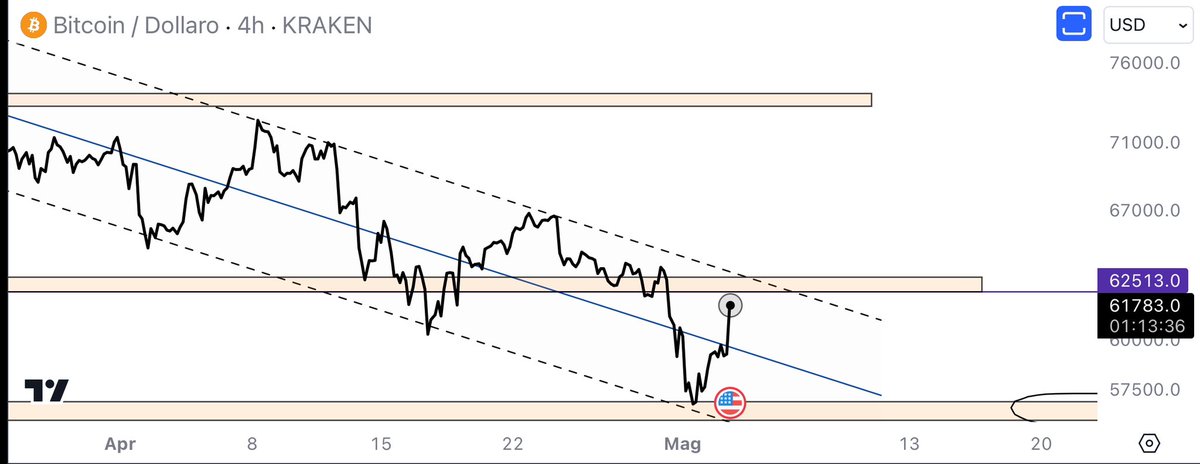
Following a dip below $60,000 before the April 20 halving event, Bitcoin is quickly advancing towards the $62,000 region. This remains a critical point on investors’ radar, yet it has not been convincingly retested. Analyst Eliz mentioned that despite Bitcoin’s recovery from below $60,000, the hurdle to overcome remains the same, highlighting $62,000 as a key level.

Another analyst, Val Me, shared a chart showing a long green engulfing candle on the four-hour timeframe for Bitcoin, discussing the significance of the $65,000 level after examining the ground above $60,000. Crypto phenomenon Lark Davis, using exponential moving averages on the daily chart, pointed out that Bitcoin is currently facing resistance at the 100-day EMA level of $59,972. For Davis, the next major resistance is at the 50-day EMA, currently at $63,902, where a strong rejection is not desired:
“What we want to see now is a definite candle close with some volume above this.”
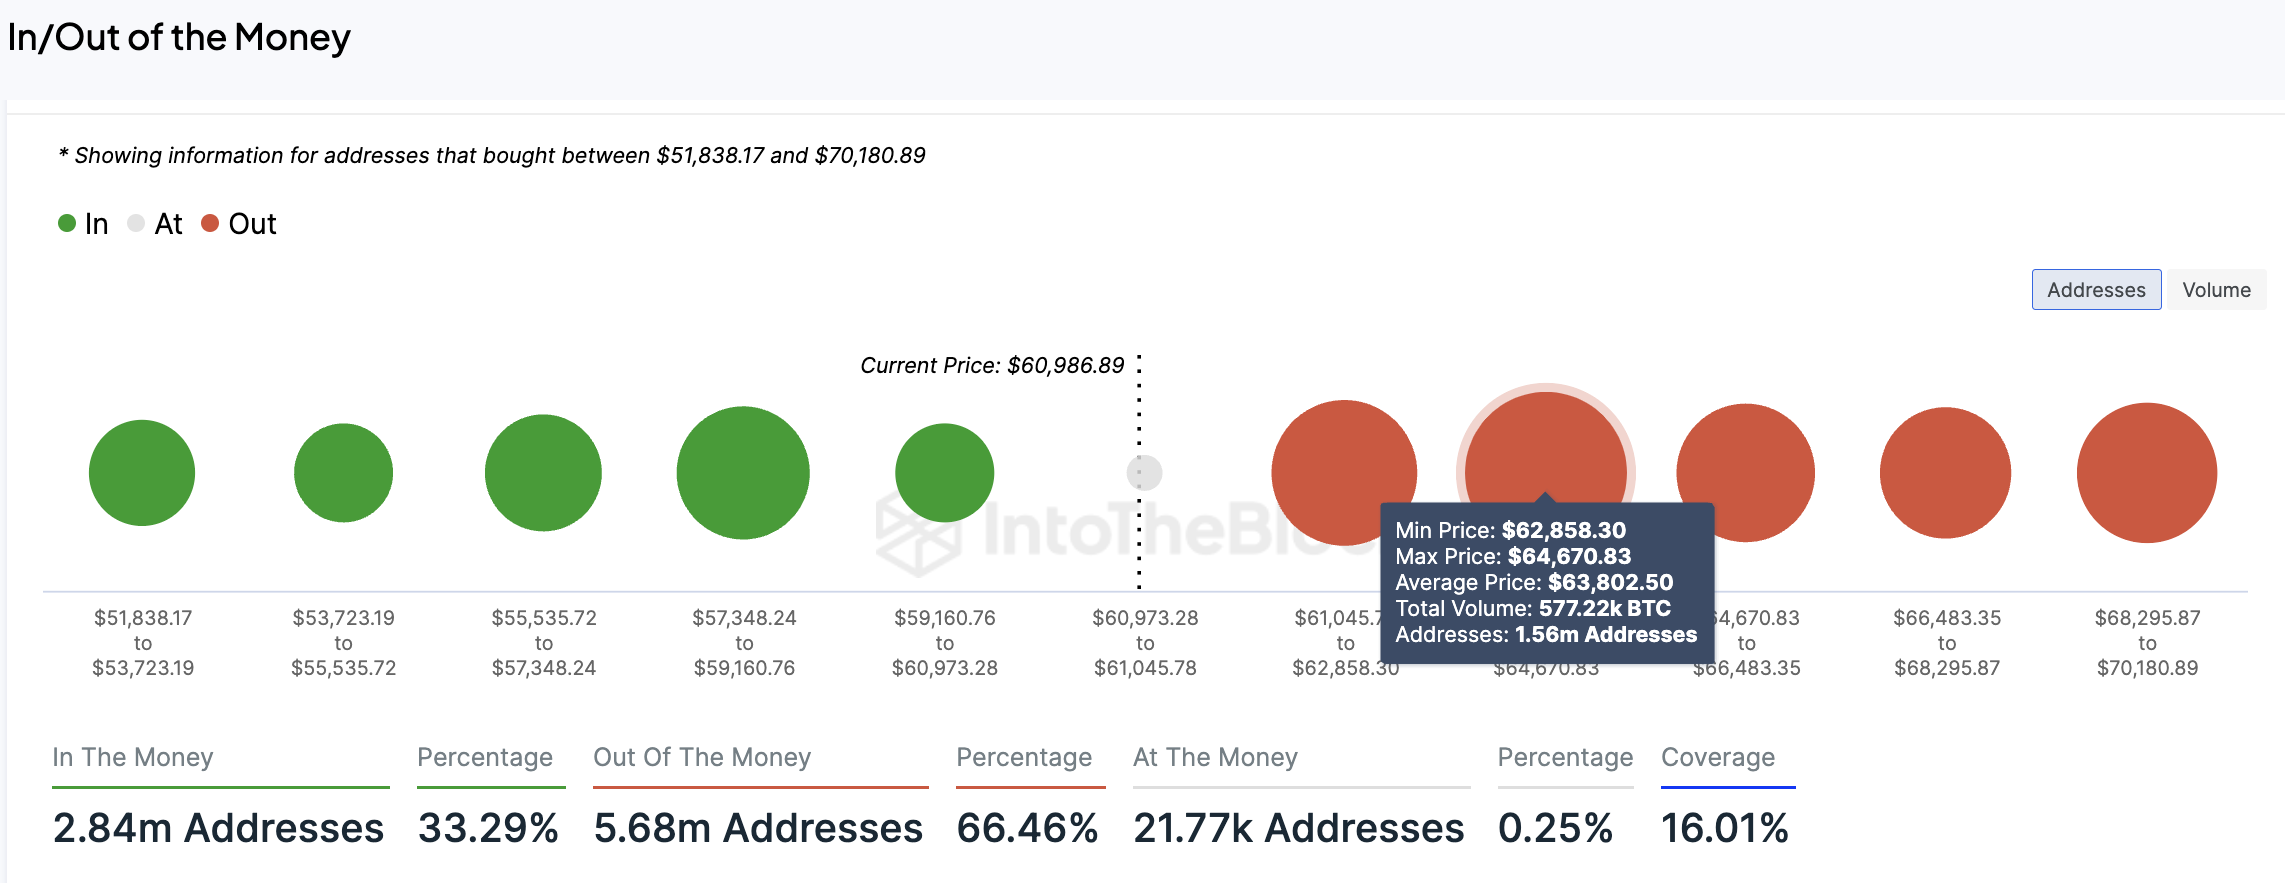
Davis’s observation is supported by on-chain data from IntoTheBlock. The Price Surrounding Money In/Out (IOMAP) model shows that the 50-day EMA average lies between $62,858 and $64,670, where approximately 577,220 Bitcoins were previously purchased by 1.56 million addresses.

Noteworthy Comments on Bitcoin
Independent analyst Crypto Wealth suggested that if the $60,000 level is maintained, the first target for Bitcoin could be $82,000. Popular analyst Ali Matinez shared a chart showing a buy signal on the daily chart’s TD sequential indicator, aligning with the ongoing recovery:
“Bitcoin is expected to recover in one to four daily candlesticks.”
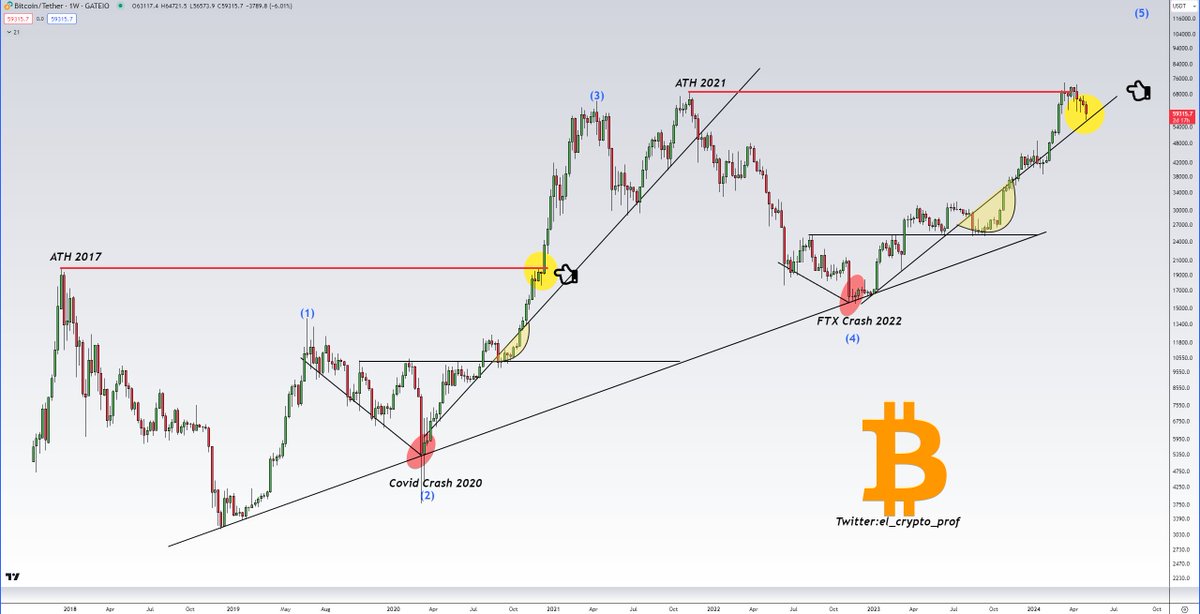
Meanwhile, crypto investor Moustache posted the following chart on X, indicating that Bitcoin is retesting a rising trend line that has supported its price since the beginning of 2023:
“That thing is going higher. It’s just a matter of time.”

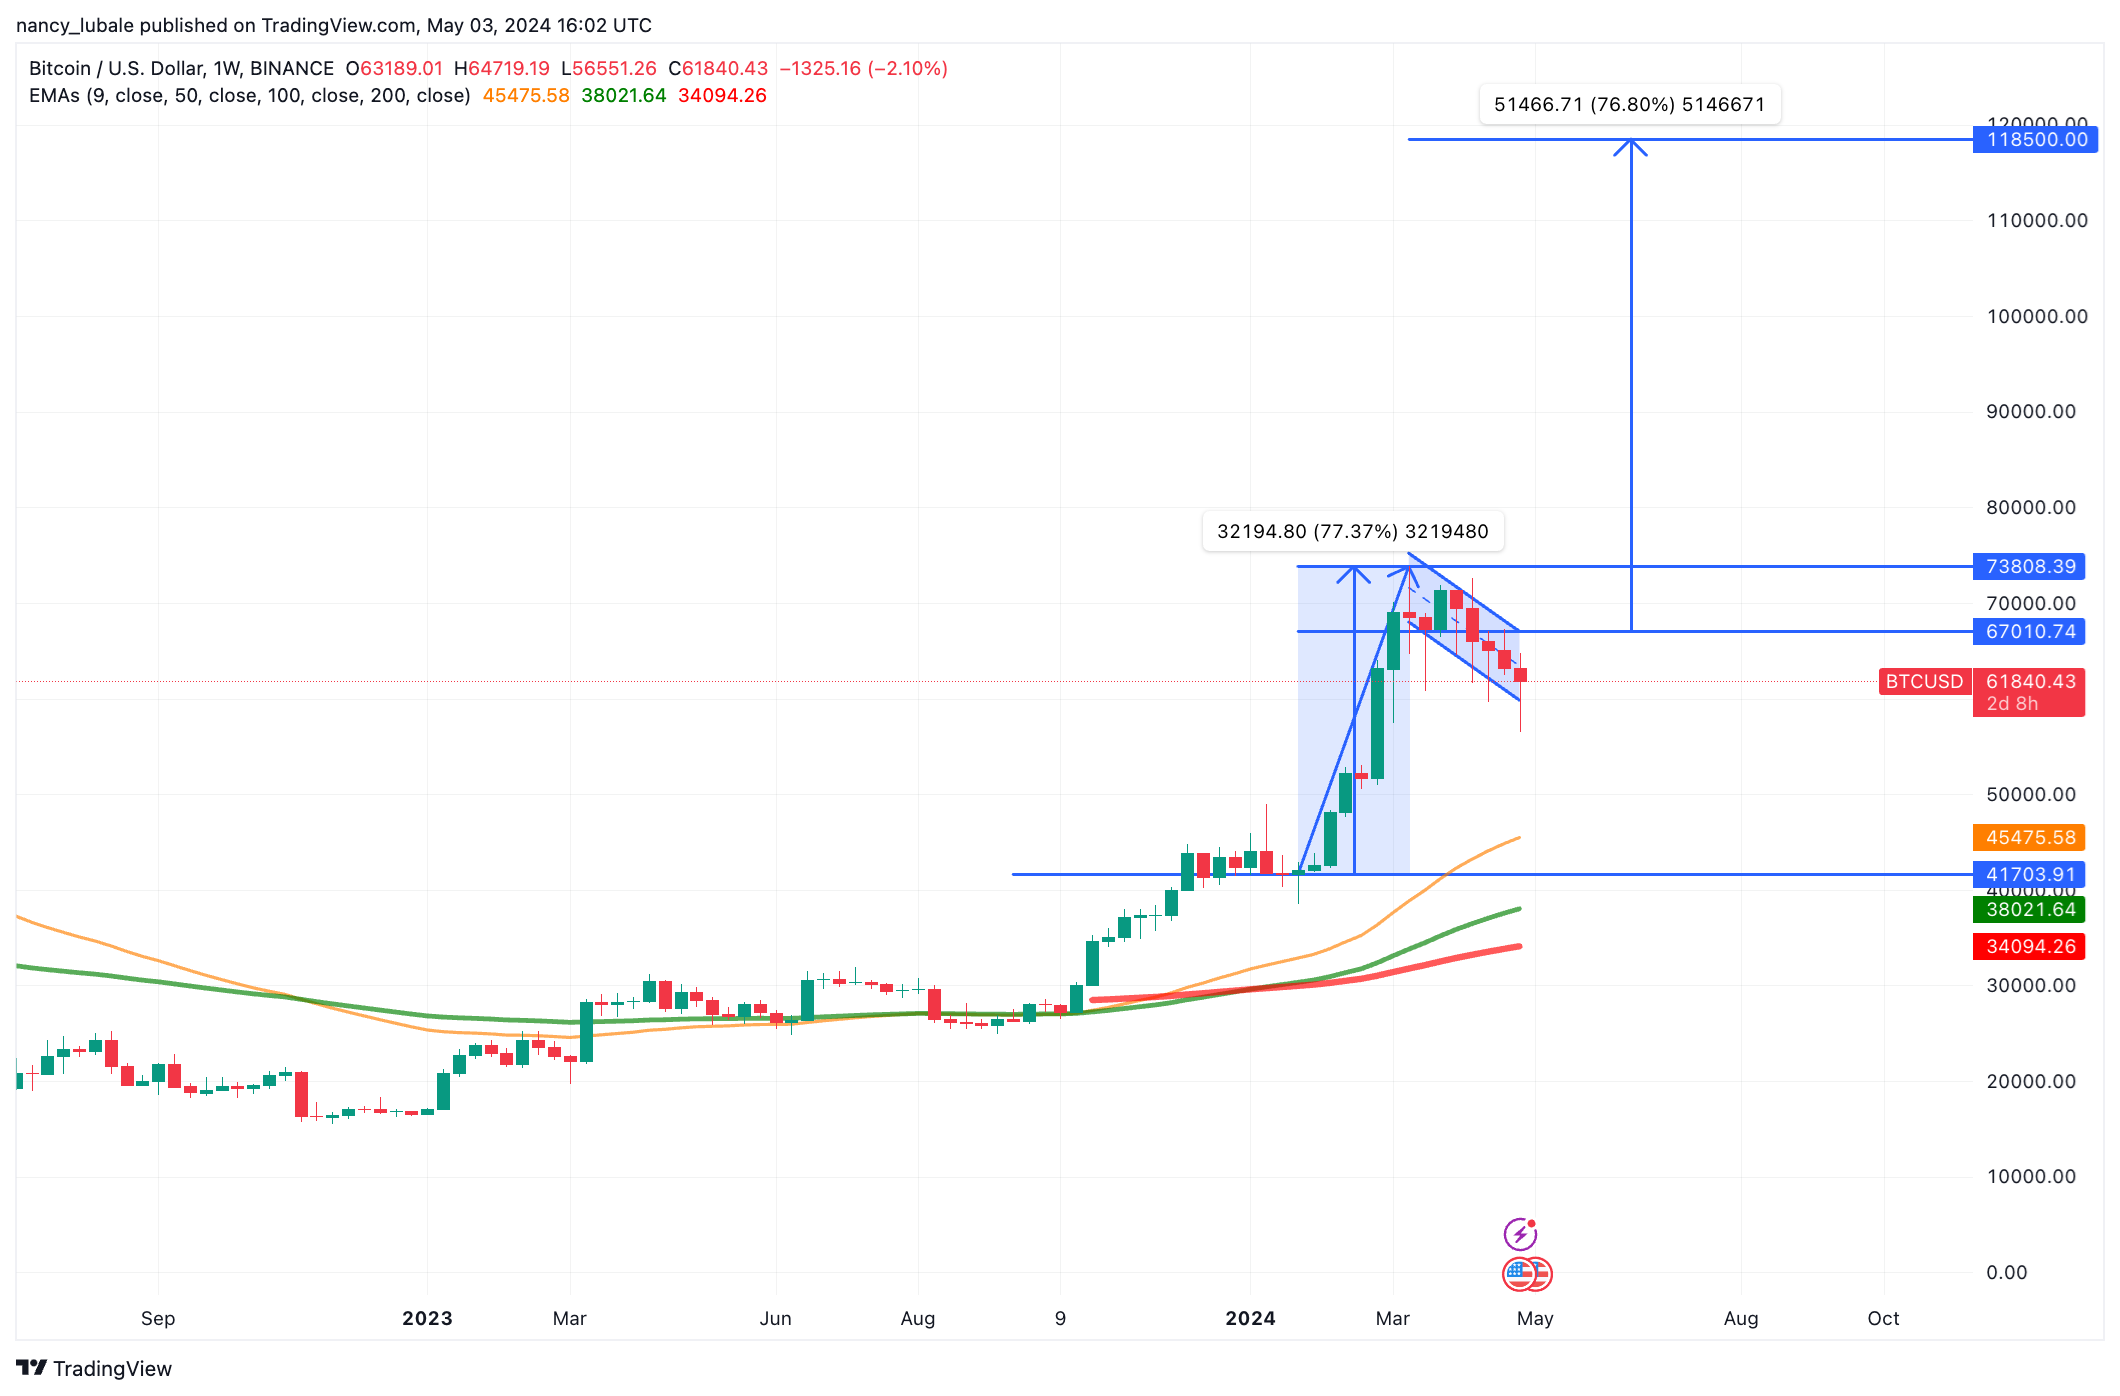
Technically, Bitcoin’s price action has drawn a bullish flag on the weekly chart, indicating a continuation of the uptrend. Bitcoin bulls are encountering resistance at the flag’s upper boundary of $67,000. A weekly candlestick close above this level could signal a breakout from the pattern, potentially leading to an all-time high of $73,808 and possibly reaching $80,000.


