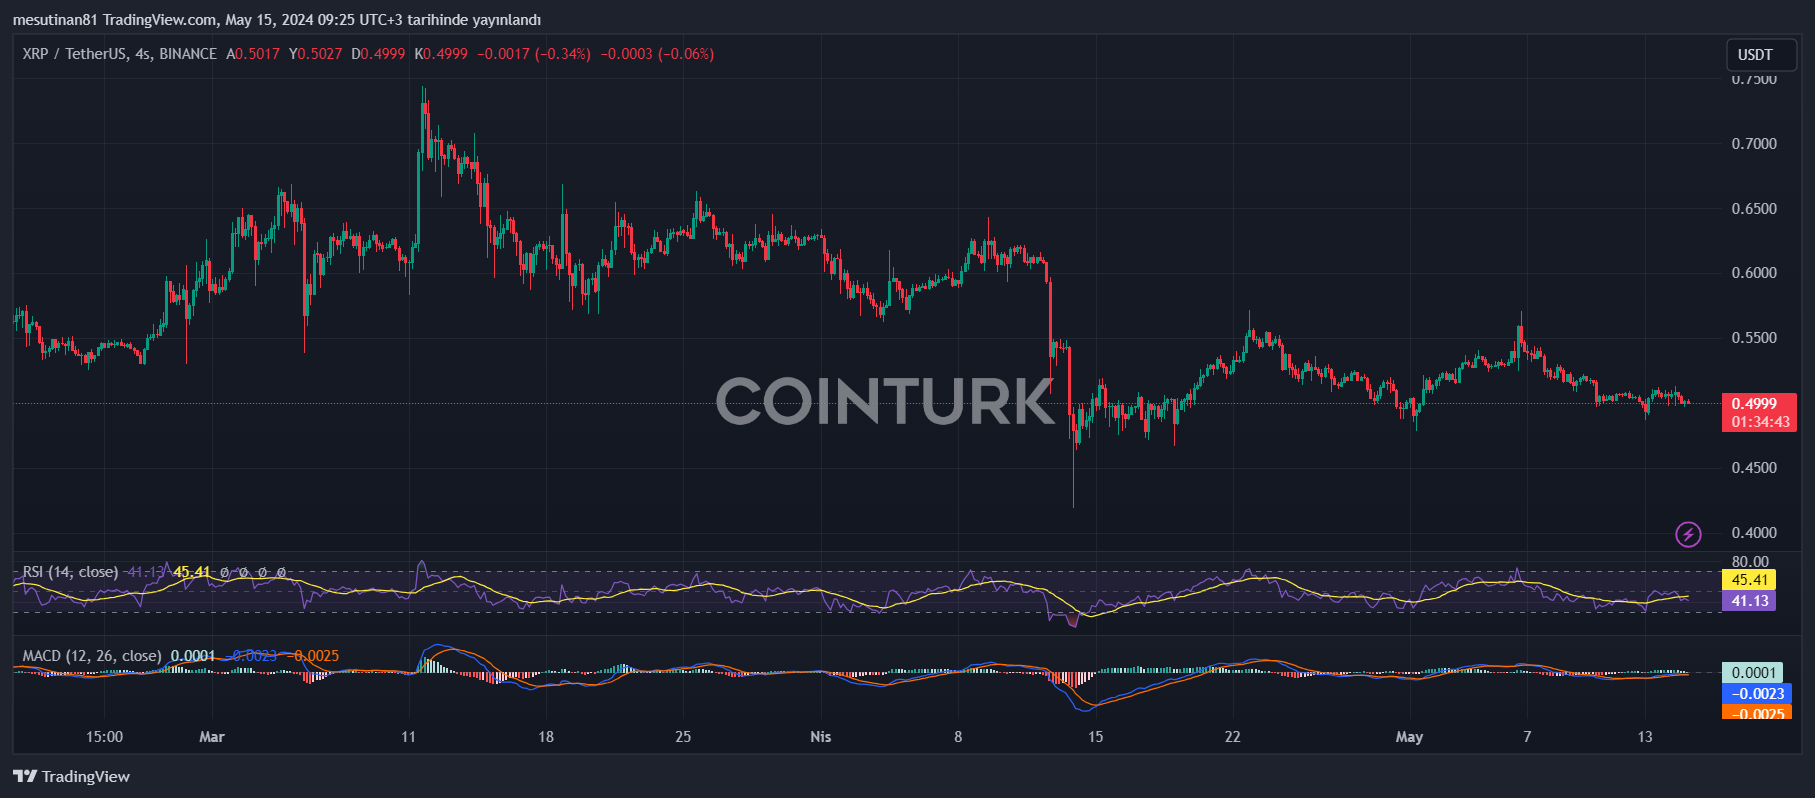
In the cryptocurrency market, XRP has been in a noticeable struggle for the past five years, exhausting and disappointing its investors. The price struggles to gain momentum to surpass the $0.5120 resistance. However, if it breaks above this level, a significant increase could occur. Currently, the price is at $0.5050. This situation could be seen as a sign of a bearish trend in the near term.
What is the Key Resistance for XRP?
Looking at the four-hour chart of the XRP/USD pair, we encounter a significant resistance at the $0.5040 level. This is important as an indicator of a short-term bearish trend. However, if this resistance is surpassed, an increase in price can be expected. Especially if there is a close above the $0.5120 resistance, a positive moment for XRP could occur.
In yesterday’s assessments, we noted that XRP showed a recovery trend along with other cryptocurrencies like Bitcoin and Ethereum. The price gained some momentum by breaking above the $0.4950 and $0.50 resistance levels. However, due to the $0.5120 resistance, a correction occurred, and currently, the gains are retracting.
In the upcoming period, the key resistance levels for XRP are positioned around $0.5060 and $0.5120. If these levels are surpassed, a significant potential for price increase could emerge. Especially if the bulls persist above the $0.5120 resistance, we could see a rally towards the $0.5250 and even $0.5350 resistance levels.
Downside Risks for XRP are Increasing
Surpassing the $0.5040 resistance region could be a positive signal for the asset, but for now, more downside risk is apparent. If there is a break below the $0.5040 level, prices could decline further.

Currently, the first significant support on the downside appears to be around $0.4965. However, in a more comprehensive bearish scenario, it becomes likely to fall below the $0.4925 level. In this case, a move towards the significant support region of $0.4865 could be observed.
Technical indicators point to a higher likelihood of further decline for the XRP/USD pair. The four-hour MACD indicator is losing speed in the bearish region. This indicates that selling pressure could increase. The four-hour RSI is also below the 50 level, indicating a bearish momentum.
The main support levels to watch are $0.4965 and $0.4925. However, for an upward movement, the $0.5040 and $0.5120 resistance levels need to be surpassed.

 Türkçe
 Español


