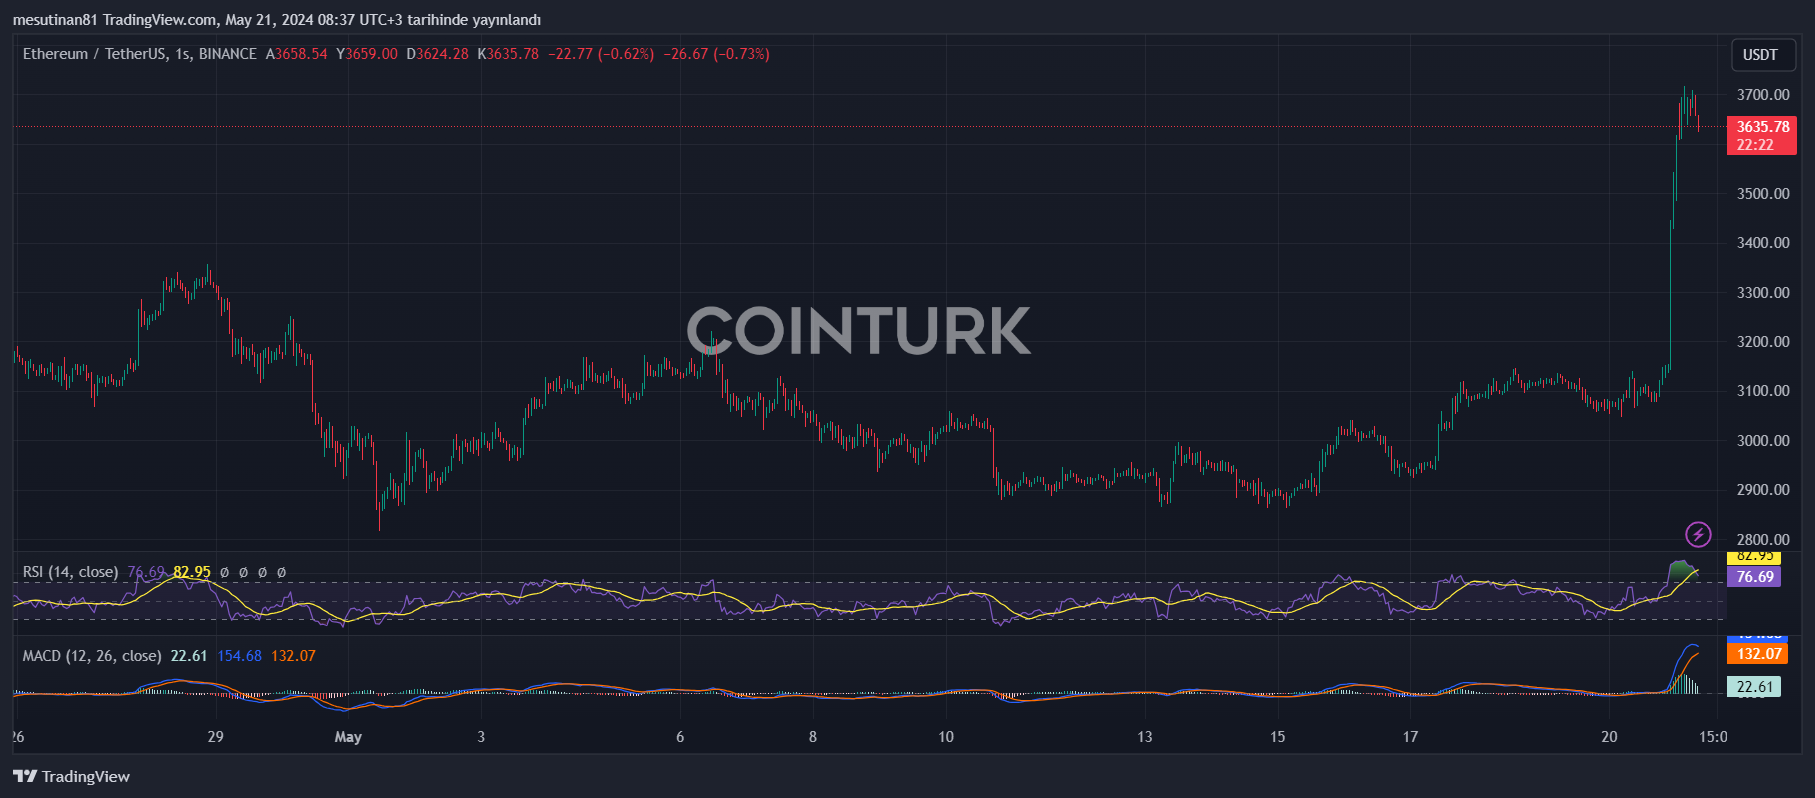
Cryptocurrency market activity last night led to a significant increase in Ethereum (ETH) price. Ethereum gained over 20% in value due to rising hopes for the anticipated ETH ETF approval. This surge allowed ETH to surpass the $3,500 resistance zone, with the price starting to trade above $3,600.
Ethereum Price Exceeds $3,600
Ethereum price initiated a new uptrend after surpassing the $3,200 resistance zone. The recent moves by the U.S. Securities and Exchange Commission (SEC) increased hopes for an ETH ETF, enabling Ethereum to make a strong upward move above the $3,350 resistance zone.
Performing better than Bitcoin, Ethereum gained over 20% in value and surpassed the $3,500 resistance zone, reaching $3,721. ETH is currently trading above $3,600 and the 100-hour Simple Moving Average. The ETH/USD pair’s hourly chart also shows a short-term rising channel with support at $3,640, which could help the price rise further.
Resistance Levels for ETH
Ethereum’s immediate resistance is at $3,700, with the first major resistance at $3,720. A break above $3,720 could push the price even higher.
If the $3,720 level is surpassed, the next key resistance is at $3,800. If this level is also breached, the price could rise towards $3,880. Should the price manage to climb above $3,880, a move towards the $3,950 resistance could be observed. Further gains could push ETH to the $4,000 resistance zone.
If ETH Faces Declines
Currently, there are signs that if Ethereum fails to break the $3,720 resistance, it could start a downward correction. In this case, what levels and technical indicators should investors watch closely?
Firstly, the initial support on the downside is near the $3,640 level and the channel region. This level is frequently tested during short-term corrections. If this support level is broken, the next major support is at the $3,600 region.
This critical support point acts as a safety net for investors. However, a clear move below the $3,600 support could push the price towards the $3,500 level. In case of further losses, the price of Ethereum could drop to the $3,400 level.
What Do Technical Indicators Say?
When evaluating Ethereum’s current price movements, it is essential to closely examine technical indicators. The hourly MACD is losing momentum in the bullish zone for the ETH/USD pair. This indicates that the bullish momentum is weakening and suggests a potential correction.

Another important indicator, the hourly RSI (Relative Strength Index), is currently correcting from the 85 region. The RSI’s decline from this high level indicates it is exiting the overbought condition, suggesting that the price could be under downward pressure. Thus, technical indicators signal a potential pullback in Ethereum’s price.
What to Expect for Ethereum Price?
In light of these data, investors should be cautious at current levels and closely monitor potential support points. The main support level identified at $3,600 is a critical threshold.
If this level is breached, more significant losses could occur, with the price potentially falling to $3,500 or even $3,400. On the other hand, if the price breaks the $3,720 resistance, the upward movement is expected to gain momentum again.

 Türkçe
 Español


