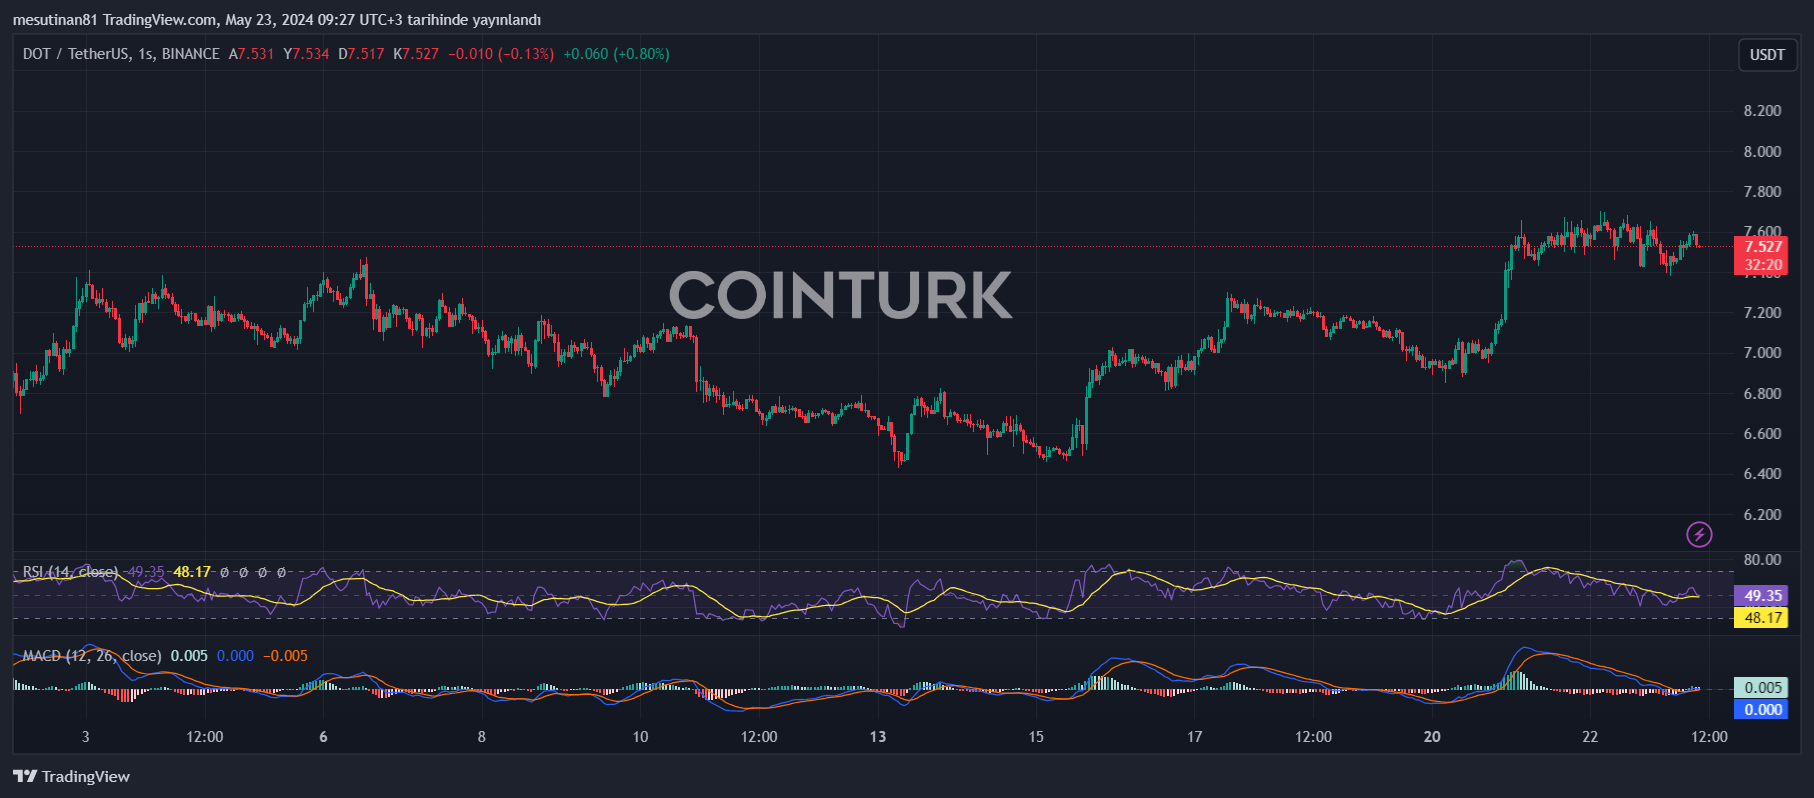
Recently, the cryptocurrency DOT gained momentum, testing the $7.70 resistance level against the dollar. The price trading above the $7.20 region reinforces investor confidence. Meanwhile, the DOT/USD pair’s hourly chart shows a significant uptrend line forming with support at $7.40. However, if the pair does not stay below the $7.20 support, the uptrend may continue.
Polkadot Price Activity
Polkadot‘s price activity began after establishing a solid base above the $6.80 level. The price overcame several hurdles, rising around $7.20 and even surpassing $7.65. Consolidation at the highest level of $7.69 indicates a similar trend in other cryptocurrencies like Ethereum and Bitcoin.
Furthermore, the DOT/USD pair’s hourly chart shows a significant uptrend line forming with support at $7.40, attracting investor attention. The immediate resistance level is around $7.70. In the upcoming period, the next major resistance is around $7.80.
If the price successfully surpasses this level, a new strong rally may begin, and DOT could easily rise to $8.20 in the near term. The next major resistance level appears to be moving towards the $8.50 region.
Will DOT Price Meet the Rise Expectations?
Recent fluctuations in the cryptocurrency markets also affect the DOT/USD pair’s course. Failing to initiate a new rise above the $7.70 level, DOT price may continue its downward movement. The $7.40 level, identified as the first significant support level, could be a critical point.

Moreover, in the case of a deeper correction, the $7.30 and then $7.00 levels gain importance. If these levels are breached, a move towards the $6.90 support region or even $6.80 could be seen. However, it is worth noting that it is still early to say the market will retreat to these levels.
What Do Technical Indicators Say?
Technical indicators currently give mixed signals. The hourly MACD appears to be gaining momentum in the bullish zone for DOT/USD, but it is uncertain if this will be sustained. The hourly RSI (Relative Strength Index) is above the 50 level. However, how this will affect price activity is not yet clear.
Points for investors to watch are as follows: the $7.40, $7.30, and $7.10 levels should be monitored as support. Resistance levels are set at $7.70, $7.80, and $8.20.

 Türkçe
 Español


