Ripple (XRP), on May 31, closed below its 20-day exponential moving average (EMA) for the fourth consecutive day, potentially extending a seven-day price decline. A token trading below this significant moving average is a bearish signal as it indicates the current price has fallen below the average price of the last 20 days. Investors may see this as an indication that the market trend is shifting towards selling.
Technical Data on Ripple
An assessment of some key technical indicators for XRP confirmed the possibility that the altcoin could lose some of its value in the coming days. For instance, key momentum indicators were below their neutral points at the time of writing. XRP’s relative strength index (RSI) was 46.64, and the money flow index (MFI) was 40.96.
These values, along with the mentioned indicators, show that demand for XRP has decreased as market participants prefer to distribute their existing assets rather than buy new tokens. The increase in selling pressure on XRP was confirmed by a decrease in active addresses on the chain. According to Santiment’s data, the daily active addresses observed using XRP’s 30-day moving average decreased by 30% over the past month.

Daily Transactions in XRP
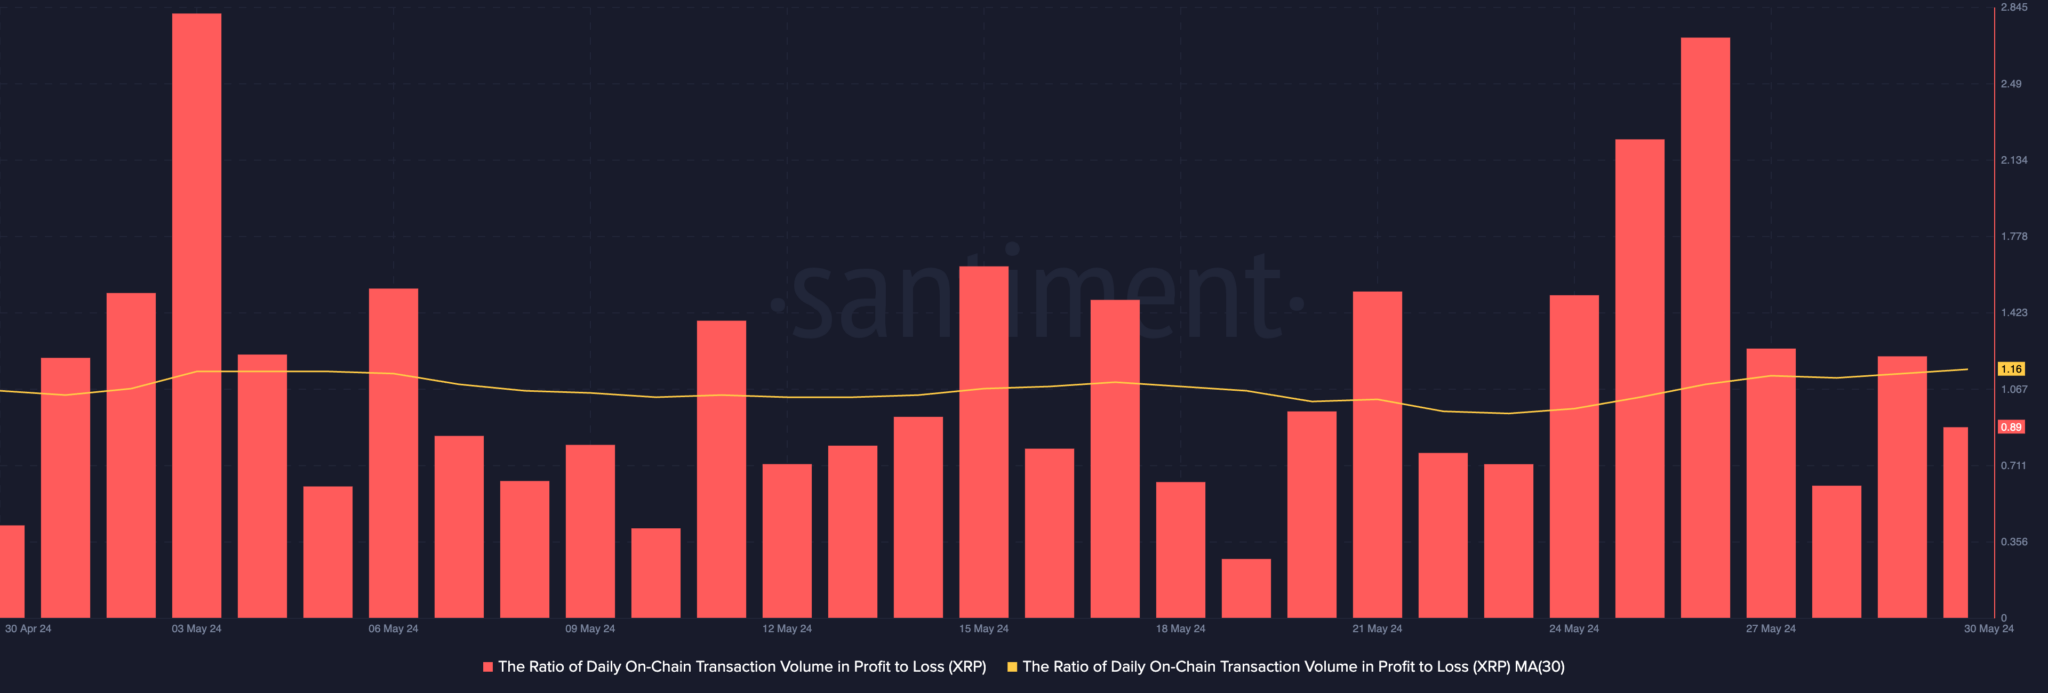
Similarly, the daily number of new addresses created for altcoin transactions also fell by 29% during the same period. Notably, a decrease in active and new addresses for a token often signals a potential drop in its price. Despite the drop in demand and price for the altcoin, daily traders continued to record profits. XRP’s daily trading volume gave a profit/loss ratio value of 1.16.
This could indicate that for every loss-making transaction during the examined period, 1.16 transactions brought profit to XRP investors. For investors looking to trade against the market, XRP’s negative market value/realized value (MVRV) ratio gave a buy signal. According to the data from the cryptocurrency analytics company Santiment, XRP’s MVRV ratios for the 30-day and 365-day moving averages were -0.7% and -8.5%, respectively, at the time of writing. This measurement tracks the ratio between a token’s current market price and the average price at which each cryptocurrency or token was purchased.

 Türkçe
 Español


