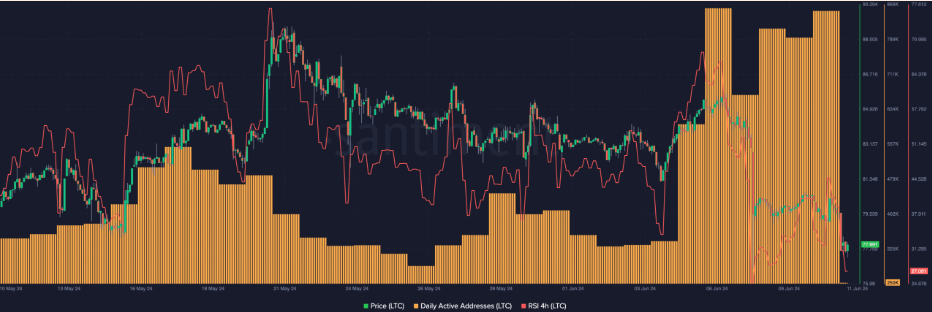
Litecoin (LTC) has always attracted attention. Recently, LTC might have formed a bullish divergence. Generally, bullish divergences can indicate the end of downtrends. A similar situation might be happening with Litecoin. According to data provided by Santiment, unique addresses transacting on the LTC network rose to 704,000 in the past seven days. Looking back to May, the total number of active addresses was only 345,000. These values suggest that interest in LTC in June is much higher compared to May.
LTC Comments and Current Status
The last time a similar situation was seen with LTC, the price rose from $78.60 to $84.63 in a short period. On the other hand, the increase in network activity was not the only indicator supporting a potential price rise.
LTC’s Relative Strength Index (RSI) also provided significant data, and RSI predictions were developing accordingly. It is known that RSI reveals overbought and oversold conditions, closely monitored by investors.

As of the time of writing, the 4-hour chart RSI value for Litecoin was near the oversold region, indicating that the cryptocurrency might be in an overselling trend. From a price perspective, this development could cause LTC to drop to $75.
Conversely, due to increasing network activity, the price of LTC could rise and suddenly reach $85.
The Future of LTC
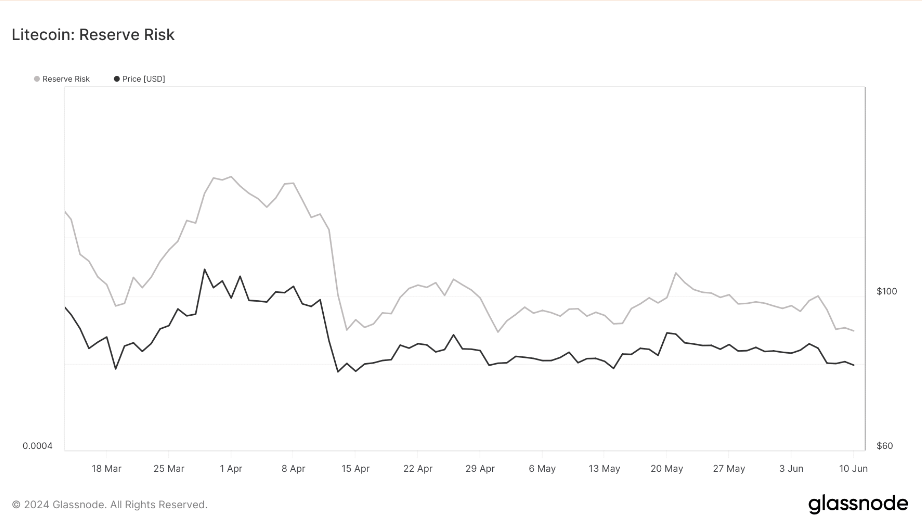
LTC’s reserve risk indicator also reflected important points. The reserve risk indicator reveals the existing confidence in the market and the risk-reward ratio of an asset. When there is an increase in the metric, it suggests that confidence is falling and the risk taken may not justify the potential gain. On the other hand, low reserve risk indicates high confidence and an attractive risk-reward ratio.

As of the time of writing, the measurement for Litecoin indicated a value of $0.00050. Although this is not definitive, it could be seen as a potential buying opportunity for LTC, but there are no guarantees. So, what might happen to LTC in the short term?
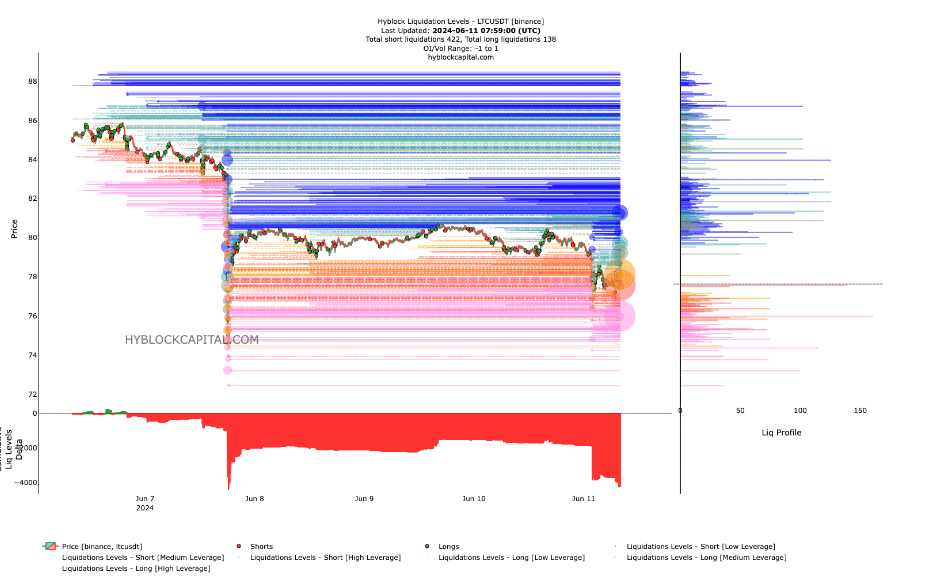
Liquidation levels could be an important indicator to understand this. These levels are known as points where liquidations could occur in the market. As of the time of writing, liquidity zones for LTC in terms of short liquidations range from $80.20 to $87.65.

The existing liquidity zones in the market suggest that price movements could potentially occur at these levels.

 Türkçe
 Español


