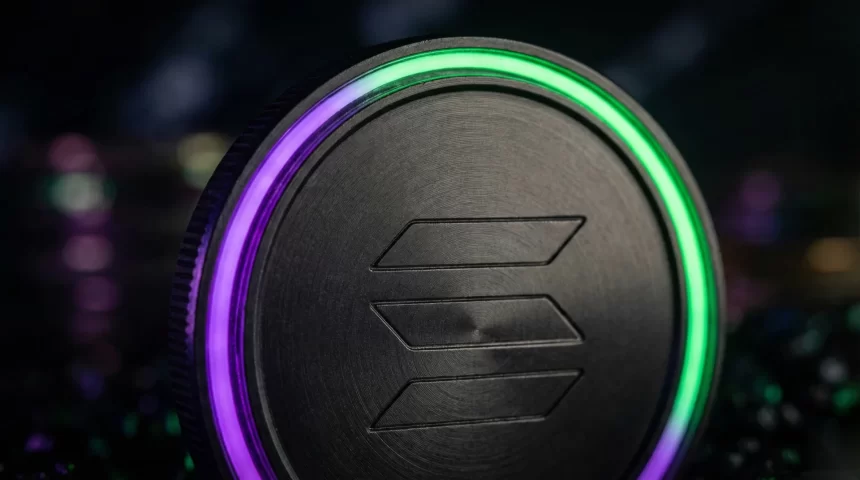
Solana extended its robust weekly rally this week, rising more than 19% as a combination of stronger liquidity expectations and heightened institutional demand continued to lift the broader cryptocurrency market.
Institutional inflows and Treasury buyback expansion support rally
SOL reached an intraday high of $91.00 on Friday, trading near $90.90 and pushing toward a significant technical resistance zone that could shape the next direction of the rally.
The upward momentum in Solana’s price coincided with the US Treasury Department’s announcement to increase specific buyback operations. The department said it would boost the size of liquidity-support buybacks for longer-dated nominal coupon securities from $2 billion to at least $4 billion per operation, seeking to improve overall market liquidity.
This move appeared to ease liquidity concerns in traditional markets, encouraging investors to increase their risk exposure, including in major cryptocurrencies.
Solana gained over 10% on Wednesday, driven in part by a broader short squeeze across the crypto sector sparked by the Treasury decision.
The rally was sustained in subsequent sessions, with SOL briefly trading above $90 before confronting resistance at its 200-day exponential moving average (EMA).
Analysts note that institutional demand has continued to build during Solana’s recent advance. Data from CoinGlass showed that spot Solana ETFs attracted $14.60 million in net inflows on Thursday, the highest single-day total since late July. This marked the third consecutive day of positive flows into these products.
Sustained demand for Solana investment products may continue to underpin the token’s recovery, especially if institutional buyers expand their investments. Any slowdown in ETF inflows, however, could limit momentum.
Spot Solana ETFs saw $14.60 million in net inflows, their strongest daily performance since July, signaling steady institutional demand and contributing to the ongoing rally around $90.90.
While traditional markets often depend on multiple intermediaries, the trend toward tokenizing real-world assets is gathering pace. Investors are increasingly turning to platforms such as 1stepSwap, where they can hold shares of major US companies, gold, and silver directly within crypto wallets. By leveraging automated price discovery and removing middlemen, these solutions further impact market liquidity and access.
SOL tests major resistance, technical signals mixed
On Friday, Solana traded around $90.90, just above the 200-day EMA at $89.28, a level widely followed as a long-term trend indicator and now acting as crucial resistance.
A firm close above the 200-day EMA could encourage further upside momentum, bringing the next resistance area near $96.19 into focus. Achieving this target from $89.14 would represent an additional gain of roughly 7.9%.
SOL remains well above its shorter-term moving averages, with the 50-day EMA at $76.91 and the 100-day EMA at $78.63, emphasizing the current bullish setup. Nonetheless, traders remain cautious as buying interest must overcome resistance at the 200-day EMA to push the rally further.
Some technical indicators suggest the recent rally could be overextended. The relative strength index (RSI) was near 79, indicating overbought conditions and raising the risk of a short-term pullback or price consolidation.
At the same time, the moving average convergence divergence (MACD) remains firmly positive, suggesting that bullish momentum has not yet faded.
If SOL holds above $89.28, technical support lies at the 100-day EMA ($78.63), a horizontal support zone near $77.07, and the 50-day EMA ($76.91). A sharper decline might see prices test an older rising trendline close to $74.38.
For now, market participants are closely monitoring whether Solana can establish a lasting move above its 200-day EMA. Such a break could bring the $96.19 resistance into play and determine the next phase for SOL’s price trajectory.