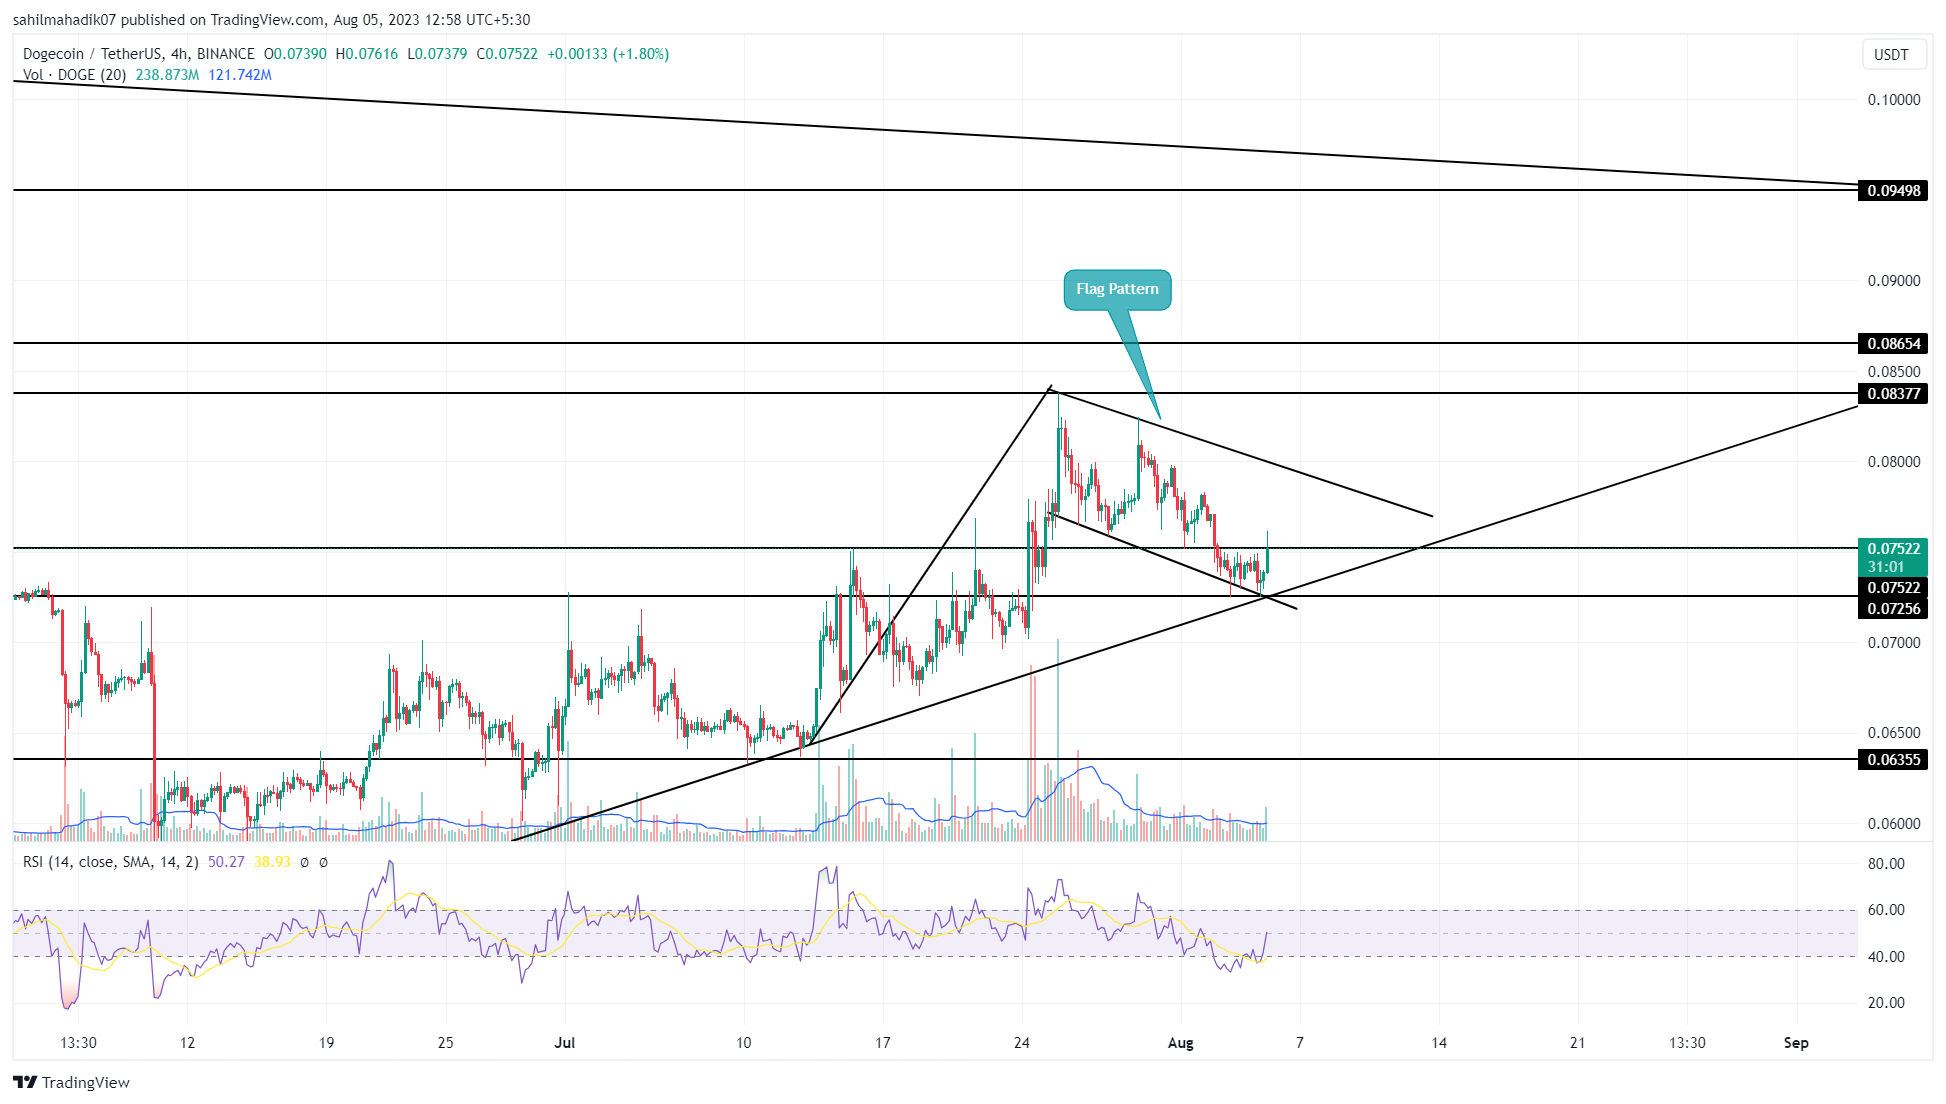
The biggest memecoin in the midst of selling pressure in the cryptocurrency market, Dogecoin (DOGE), encountered resistance at $0.0838 after which it entered a corrective phase. Over the past two weeks, the price of the leading memecoin has lost 13.4% and dropped to $0.0725, the lowest price level recorded monthly. This pullback on the daily price chart indicates the formation of a bullish continuation pattern called a flag. For DOGE to enter the next recovery cycle, this formation needs to break above the resistance trend line. Here are the highlighted scenarios for DOGE.
Dogecoin Price Analysis
In the downward trend of Dogecoin, the flag formation found support from the lower trend line. The hype caused by speculation that the memecoin will be integrated with Twitter, with its former name as X and its new name, has caused the price to move upwards for the past three days.
The daily candles with a tendency to bounce indicate that buyers are causing demand pressure at this support, increasing the likelihood of a reversal in the downward trend and the start of an uptrend. The price of DOGE breaking the $0.075 resistance at the time of writing this article also increases the likelihood of an uptrend.

If the daily candle on the time frame mentioned above closes above the mentioned resistance, buyers can increase the price by 5% to break and surpass the general trend line, potentially leading to a new rally. However, if the resistance trend line of the formation is not broken, the correction is expected to continue.
Will DOGE Break the $0.085 Resistance?
The formation of flag patterns offers investors an opportunity to buy at discounted prices. A potential breakthrough of the resistance trend line can be interpreted as the end of the correction phase. In an ideal bullish scenario, Dogecoin’s price would reach its first target level of $0.085, followed by a rise to $0.093.
While the 20 and 50-day Exponential Moving Averages (EMA) on Dogecoin’s price chart suggest a potential downward trend indicating an extension of the existing downtrend, the daily Relative Strength Index (RSI) above the 50 level indicates that buyer momentum is rising for a continuous turnaround.

 Türkçe
 Español


