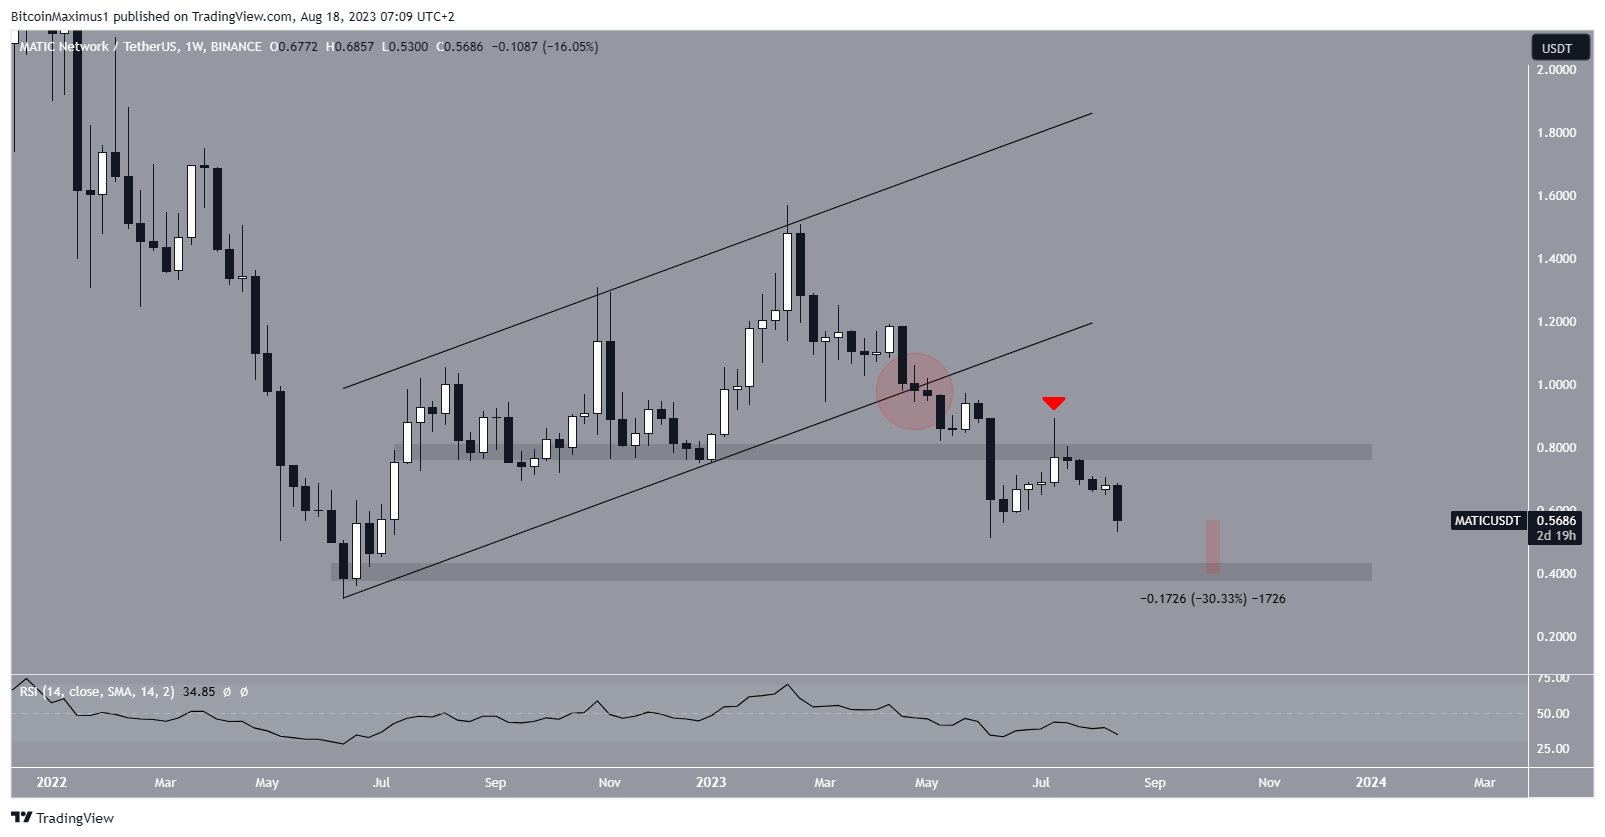
Polygon (MATIC) price broke out of a short-term ascending parallel channel and quickly approached its yearly lows. Both the weekly and daily timeframe analyses indicate a bearish trend, suggesting further downside potential before a reversal in the ultimate uptrend.
MATIC Price Analysis!
The weekly timeframe technical analysis for MATIC shows a consistent bearish trend. There are two main reasons for this. Firstly, the price broke out of an ascending parallel channel in April. Prior to the decline, the channel had been in place since July 2022. Since channels usually contain corrective movements, all the increases since July 2022 have been corrective, and the trend may now be towards the downside.
This probability was further strengthened as the MATIC price dropped below the $0.80 horizontal range. It then confirmed resistance by forming a long upper wick, which is considered a sign of selling pressure.
If the decline continues, the MATIC price could drop to the $0.40 support area, representing a 30% decline from the current price. Additionally, the weekly Relative Strength Index (RSI) may indicate a bearish outlook. RSI is a tool used by investors to assess whether a market is overbought or oversold, and it can help determine whether a token is being bought or sold.

What Are the Current Data for MATIC?
An RSI reading above 50 and an upward trajectory align with a bullish market sentiment, indicating a positive outlook for growth. Conversely, a reading below 50 can indicate a bearish trend in favor of sellers, as shown when RSI falls below this threshold. Currently, the RSI is below 50 and showing a bearish trend for MATIC. The daily analysis for MATIC is also bearish. The main reason for this could be its failure to break away from a descending resistance line on July 10.
The breakout was not sustained, and the price reversed the trend three days later. Currently, MATIC is trading well below the breakout level, just below a minor support area of $0.60. If the MATIC price falls below $0.60, it could confirm a shift towards long-term support at $0.40. This could also lead to a new yearly low. Additionally, the daily RSI supports the breakdown and subsequent decline. The indicator is below 50 and falling, both signs of a bearish trend.

 Türkçe
 Español


