The price of BTC continues to hover around $26,000, indicating a lack of increased demand during the decline. When Bitcoin fails to recover rapidly after a major sell-off, it tends to move sideways or downwards. The news flow is unfavorable for cryptocurrencies. So, how much can the prices of these 3 popular cryptocurrencies reach in possible scenarios?
Bitcoin Price Analysis
Jackson Hole concludes today, and Powell’s highly important speech failed to move the price by more than a few hundred dollars. The Fed chairman, who previously stated that inflation was transitory and would rapidly decline in 2021, now appears to be much more cautious after two years. Powell, who says inflation is still strong and further interest rate hikes may be needed, could surprise everyone in a way similar to 2021, making 2024 the opposite of 2022. This would mean a loosening of monetary policy along with a rise in risk markets, including cryptocurrencies.

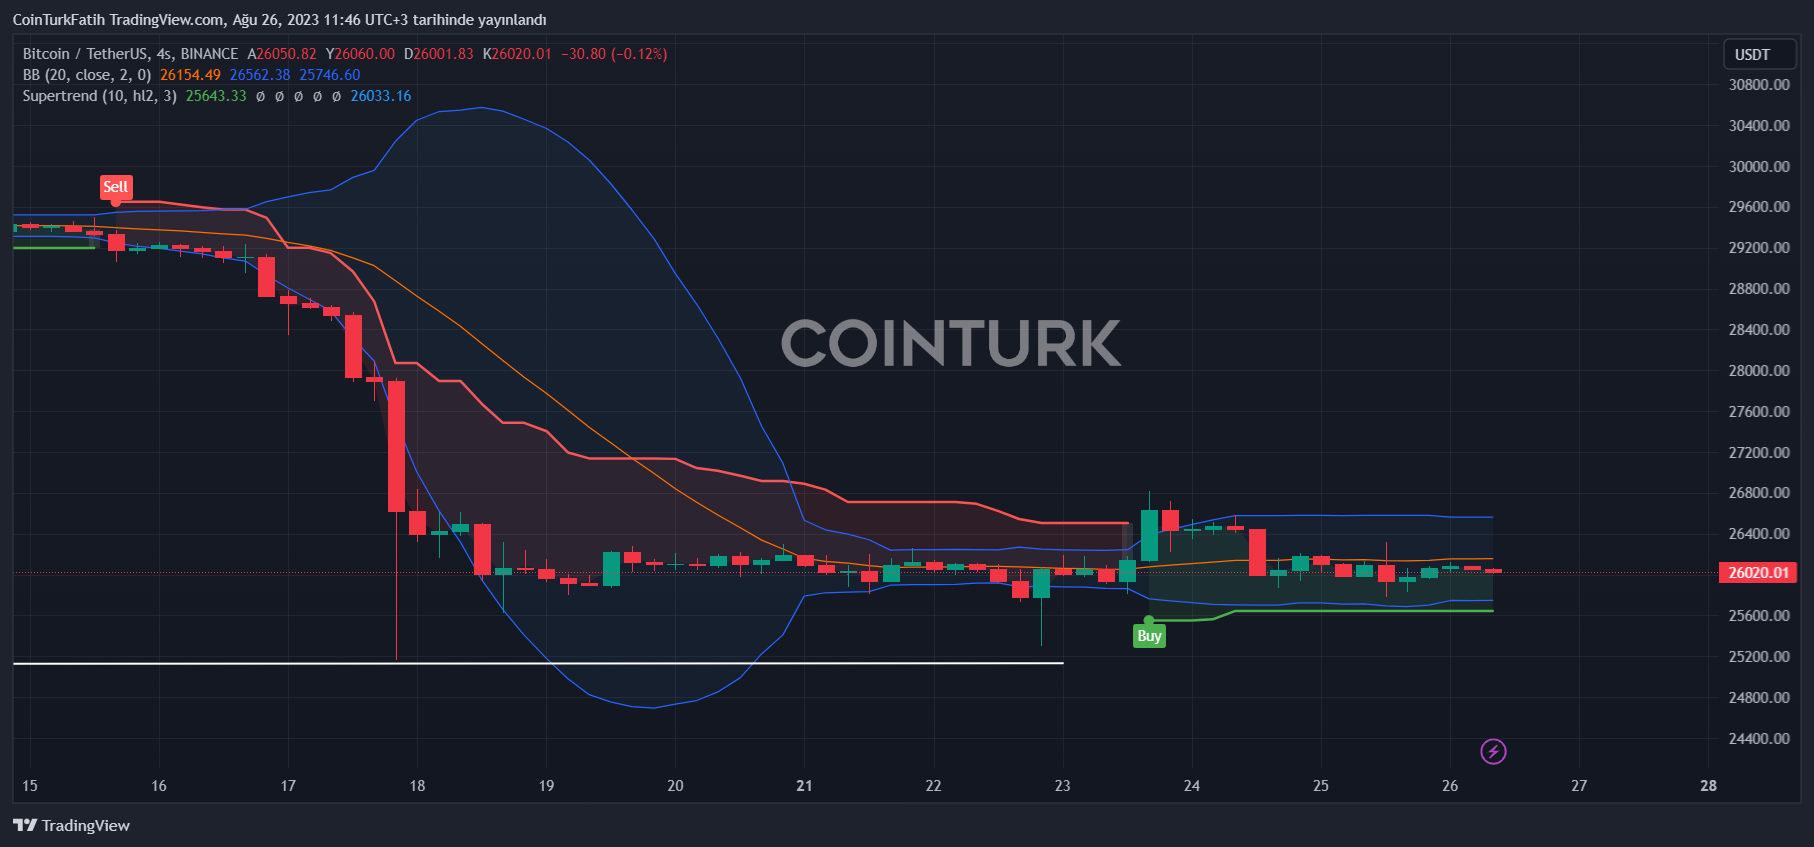
The price of Bitcoin has been largely sideways since August 18. The price has largely held the support level around $25,136. However, for a reversal to occur, we need to see convincing 4-hour closes above the $26,726 line. Then, the target can be set at the $29,000 level again.
However, if the price continues to fall and breaks the support line, selling could gain momentum down to $22,000 after $24,800.

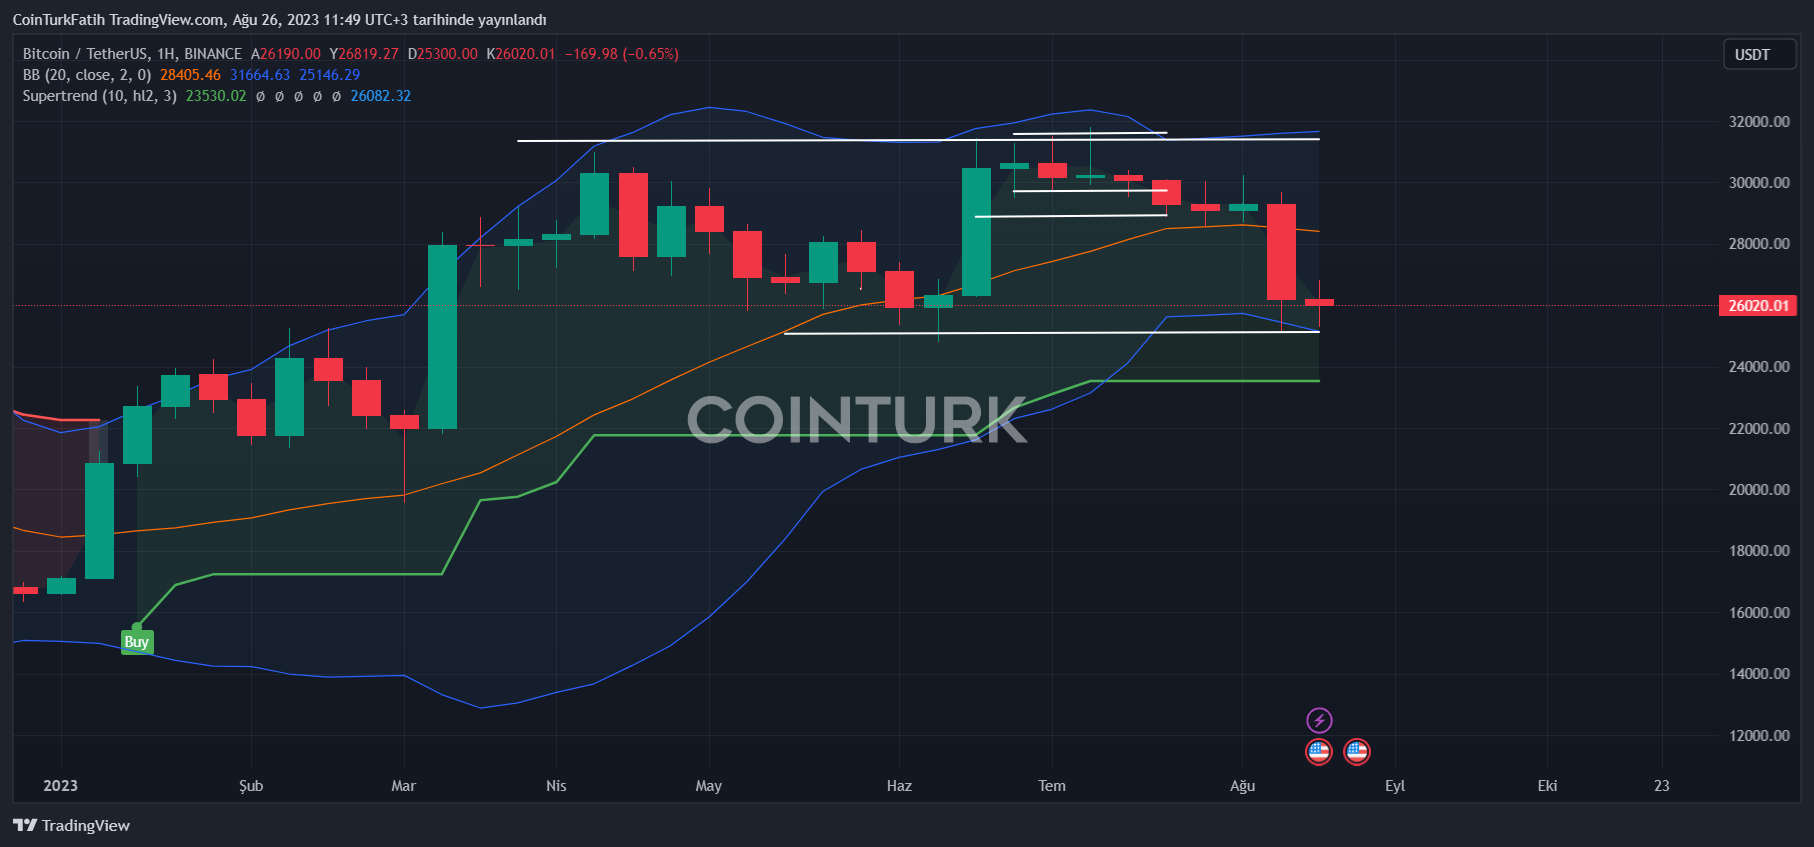
The medium-term range we drew on the weekly chart is still intact. The price is now at the support line and has been trading within the current range since the week of March 20. A breakout to the upside, meaning closes above $32,000, can now lead to the end of the downtrend in the bull market. Although a downside break is risky given the recovery of the price from the FTX crash, an upward movement seems more likely.
Polkadot (DOT) Analysis
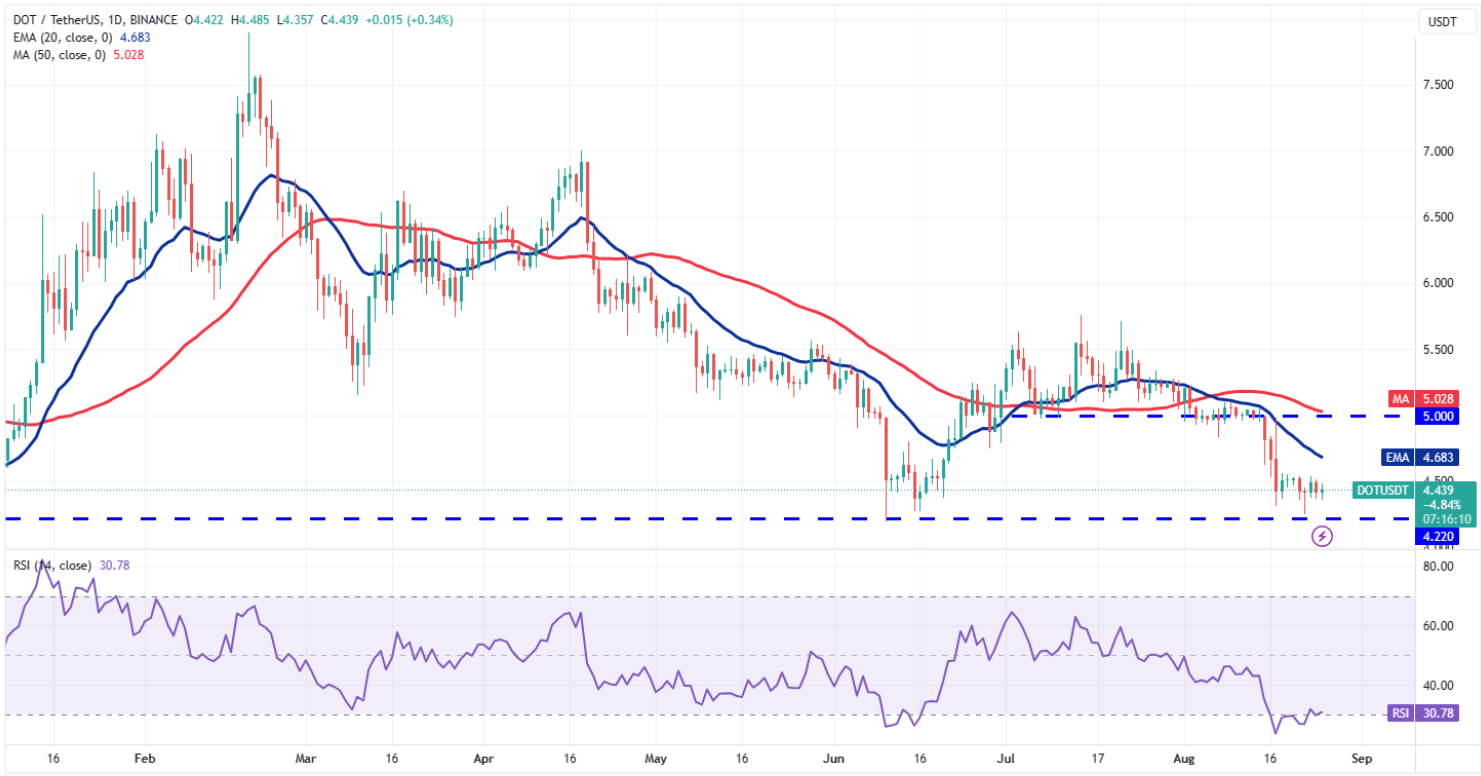
Polkadot has been trading in a narrow range between $4.22 and $4.56 for the past few days. This indicates that the bulls have successfully defended the $4.22 support but have not been able to break above the $4.56 resistance.

A small positive point in favor of the bulls is that they have not given up much ground from the overall resistance. This increases the likelihood of a breakout above the resistance. The DOT/USDT pair could rise to the 20-day EMA ($4.68) and eventually reach the $5 breakout level.
Polygon (MATIC) Analysis
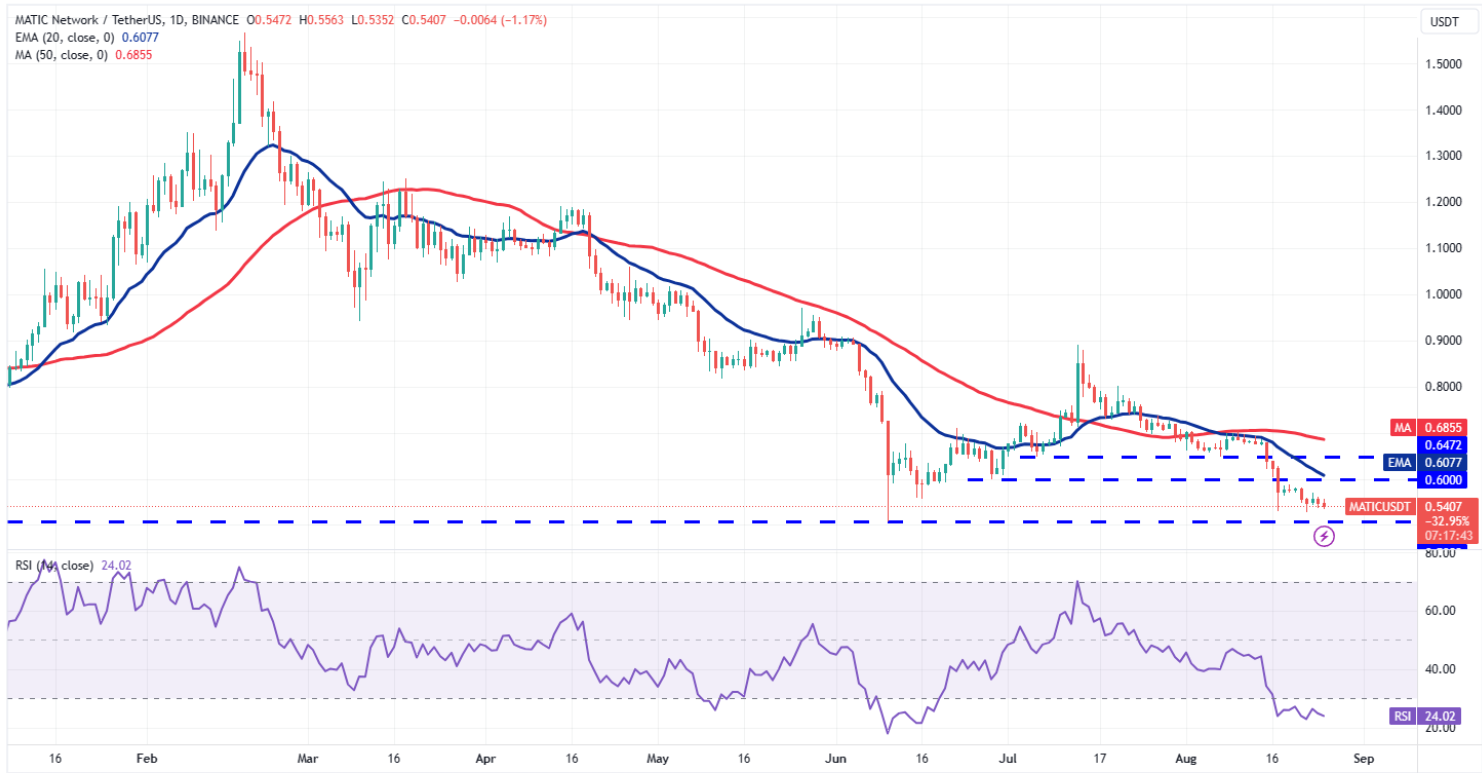
Polygon is gradually drifting towards the crucial support level of $0.51, indicating continued bearish pressure. If this area is lost, selling could accelerate, potentially leading to a drop to $0.45. The critical resistance to watch in the upside direction is $0.60. If buyers surpass this hurdle, the recovery could reach the 50-day SMA ($0.68).


 Türkçe
 Español


