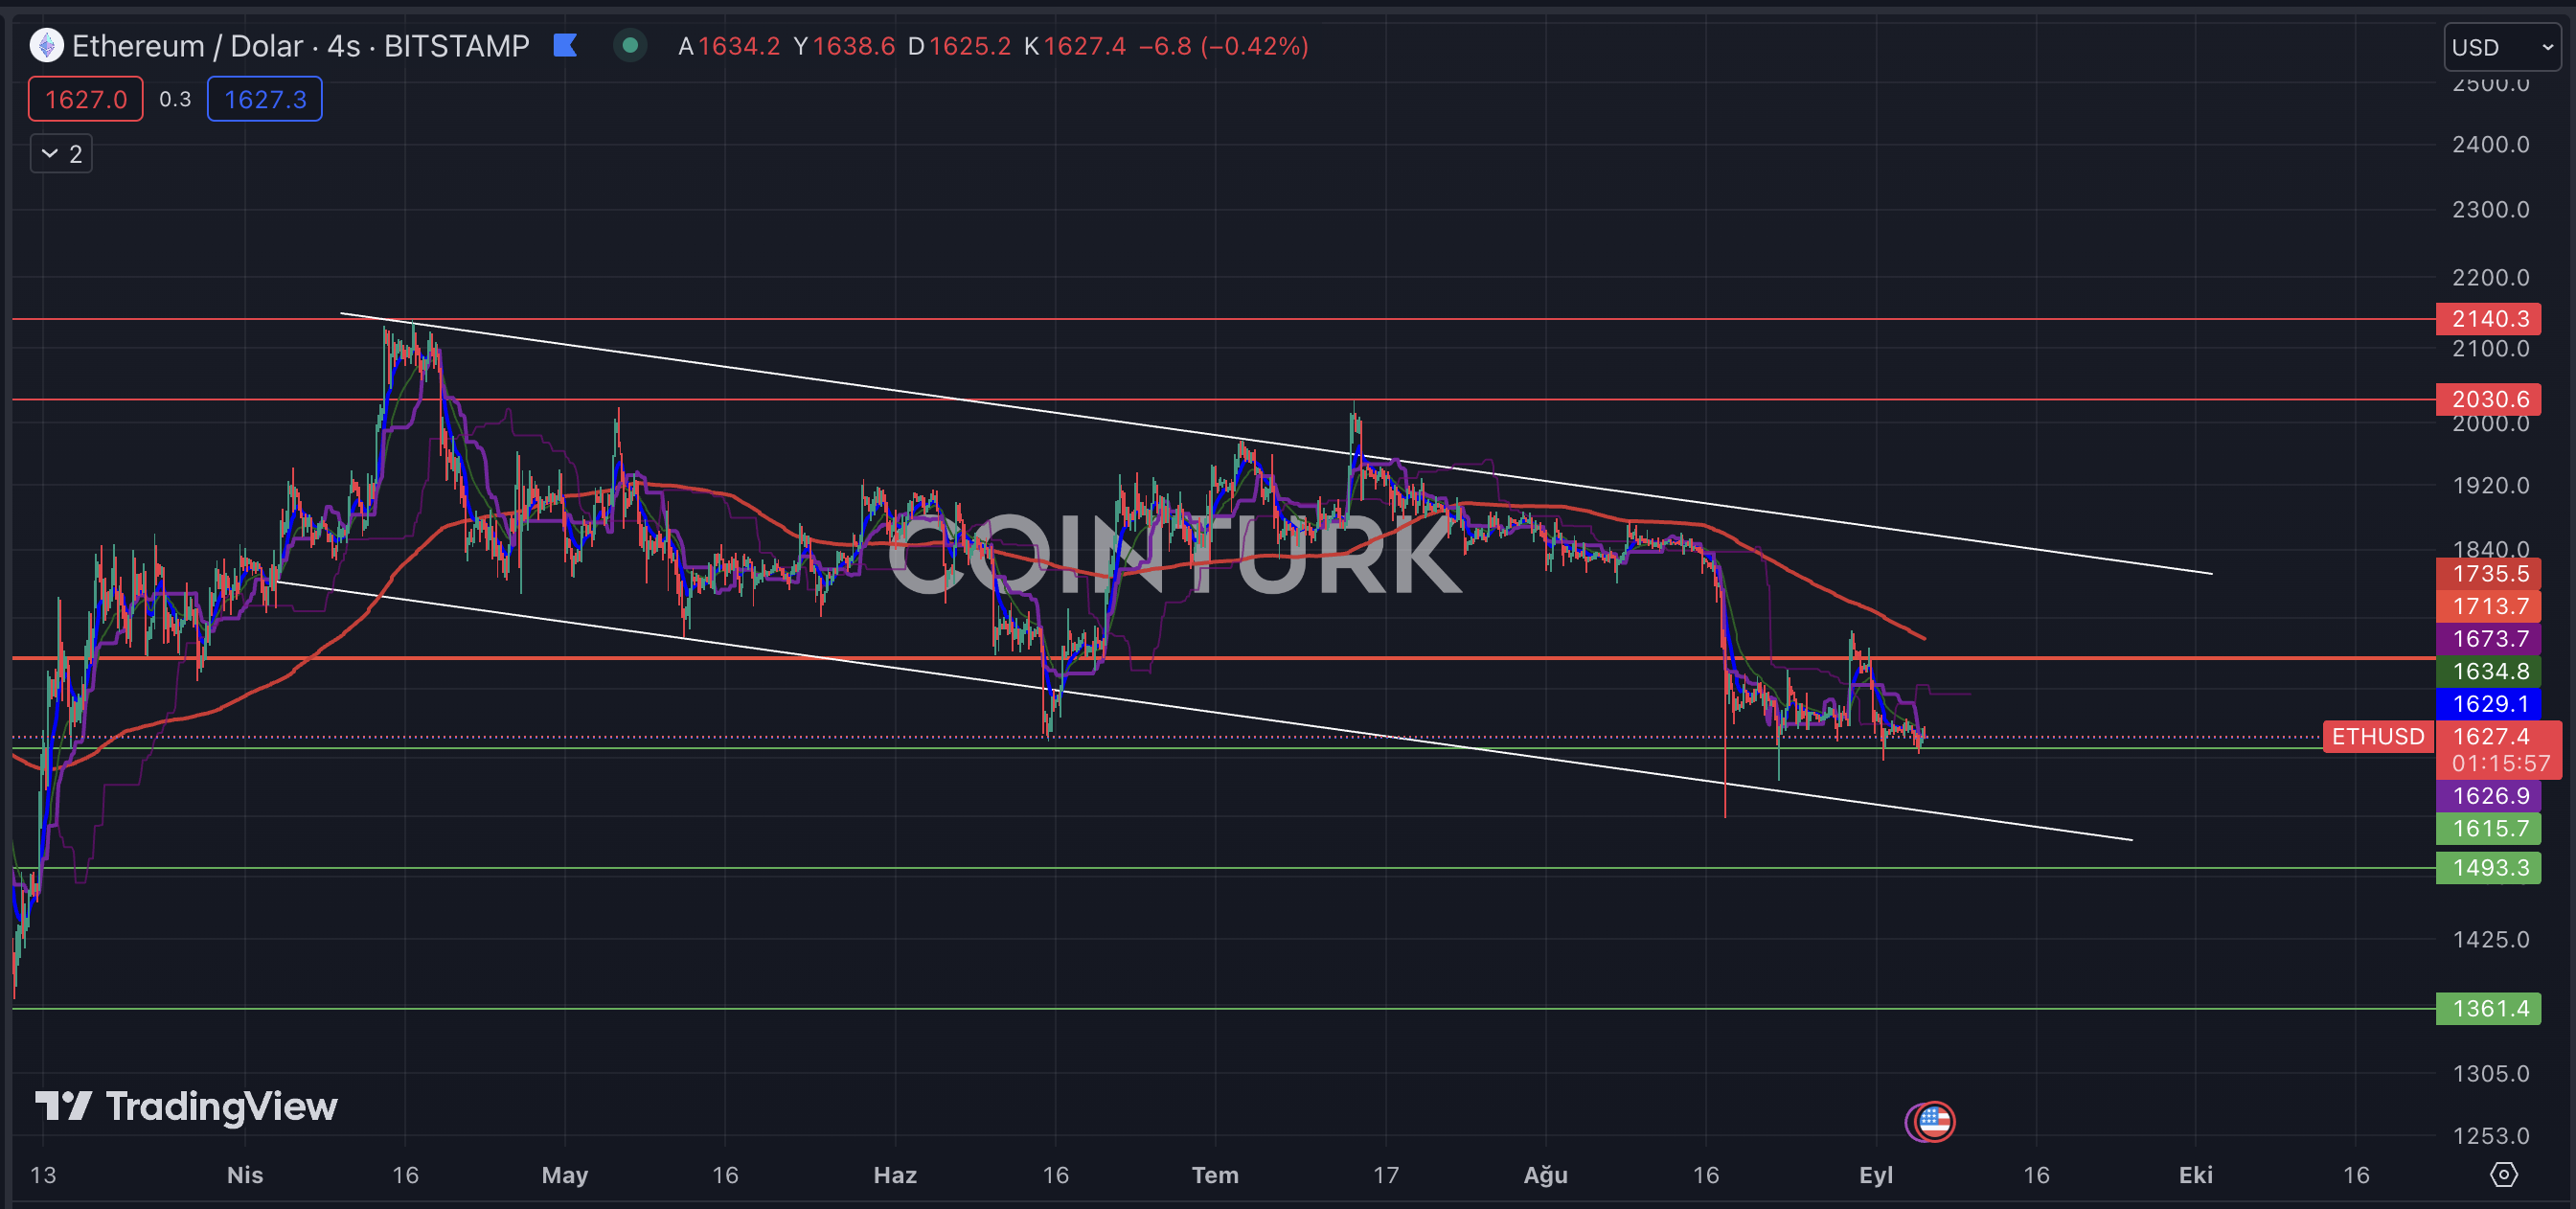
Despite the recent price fluctuations in many news headlines, Bitcoin has not been able to sustain any upward momentum, which continues to negatively affect altcoin prices. Recently, volatility in the price of Ethereum has significantly decreased, and several negative trends are evident on the chart. What does the chart analysis tell us about Ethereum, where the price is trapped in a narrow range?
Ethereum Chart Analysis
The first notable formation on the 4-hour Ethereum chart is a descending channel pattern. This formation can be interpreted negatively by many experts, and if the price falls below the support level, it can have a negative impact on the price. The only positive aspect for the price of Ethereum, which remains below important averages such as EMA 200, EMA 21, and EMA 7, is that the $1615 support level has been tested at least four times. Losing this level could trigger a significant drop.
The negative impact of the pricing of many negative news in the cryptocurrency market is also reflected in the Ethereum ecosystem, as transaction volume and user activity decline. Events such as DeFi protocol hacks, record-low trading volume in the NFT market, and rug-pull incidents with newly launched tokens have reduced user interest in the Ethereum ecosystem.

Ethereum Support and Resistance Levels
The most important support level to watch for Ethereum is the aforementioned $1615 level. Any negative news causing the price to close below this support could lead to a drop to $1493. The last support level to be cautious about is $1361.
There are several resistance levels worth mentioning due to the Ethereum price remaining below important moving averages (EMA). Based on previous closings, the resistance levels to watch are $1629, $1713, and $1820. Especially, a 4-hour closing above $1820 would end the Descending Channel Formation and eliminate a critical risk for the Ethereum price.

 Türkçe
 Español


