Glassnode’s latest weekly analysis of Bitcoin (BTC) has been published, offering intriguing insights into the current state of the market. Additionally, it provides a perspective on the market’s position in the current cycle based on historical patterns.
Key Report from Glassnode!
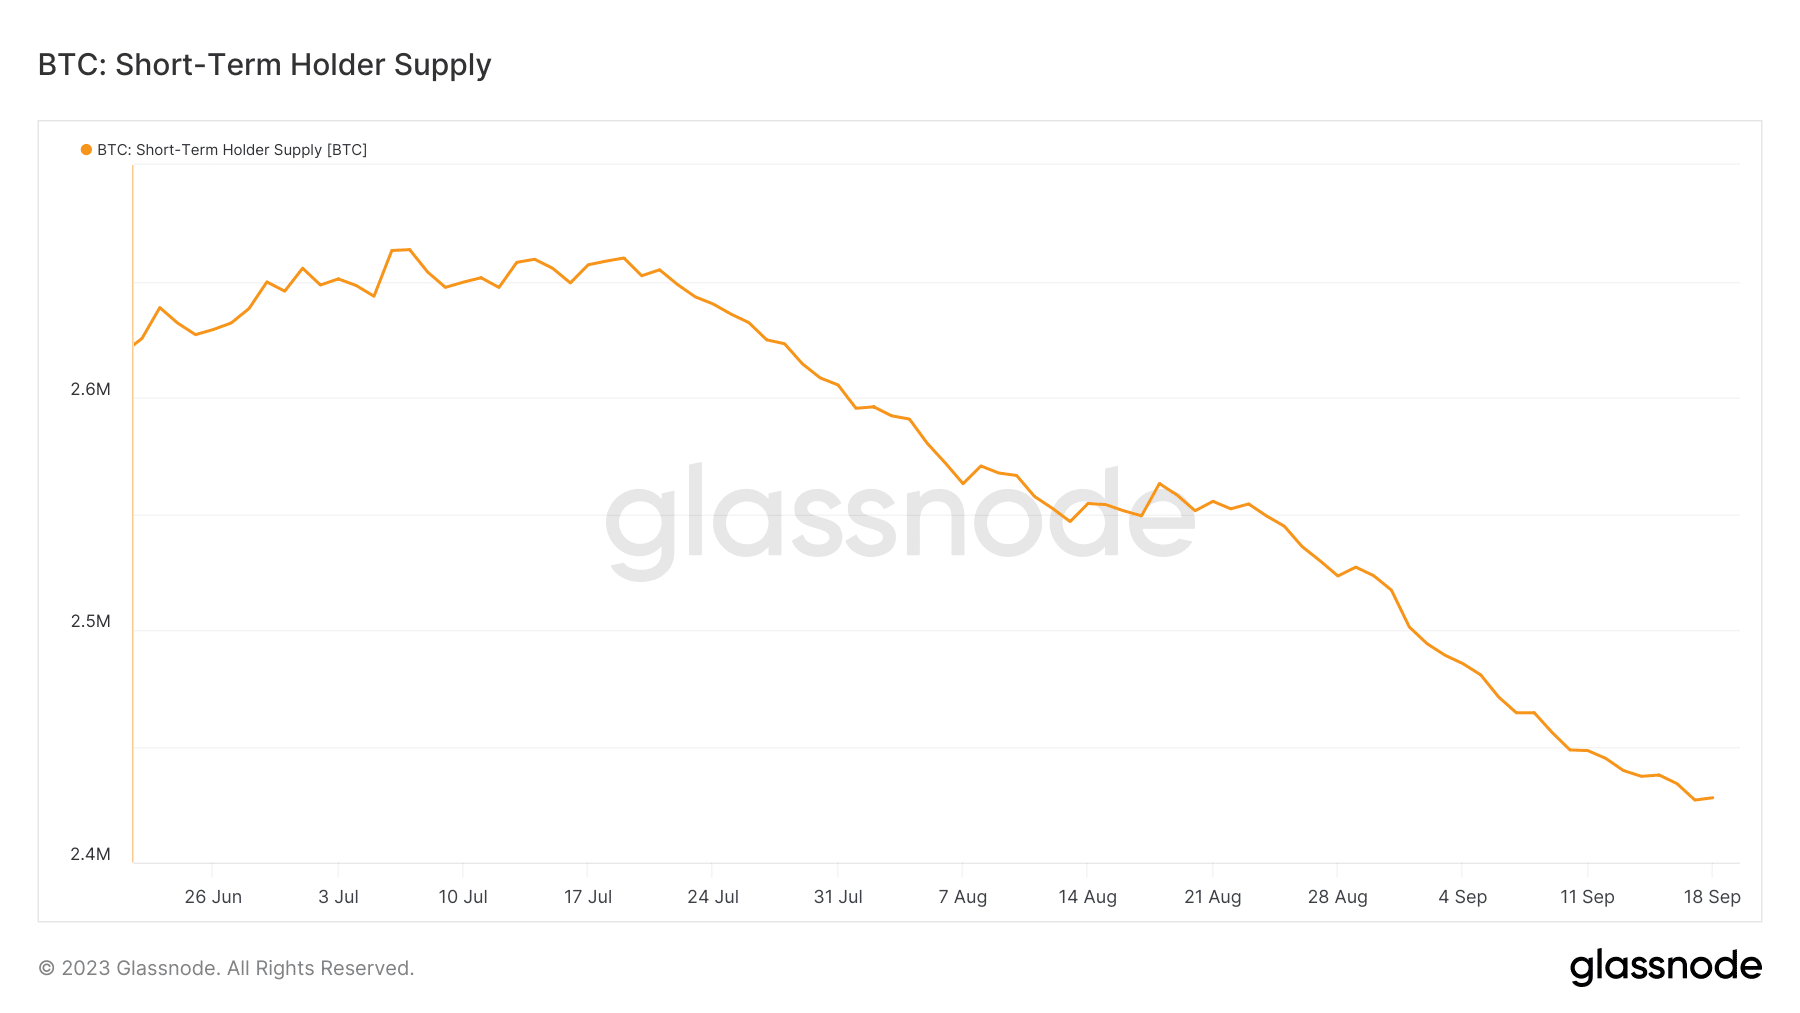
Among the notable points in the analysis by leading analytics firm Glassnode, a decline in investor confidence is observed. This loss of confidence may be particularly pronounced when looking at the short-term holder supply of Bitcoin, which recently dropped to its lowest level in three months. This situation may align with periods when Bitcoin began to relinquish the gains it made in June, reaching its highest levels.
Significant demand near $30,000 has been observed in recent periods. This indicates a certain level of regained trust in the market and represents the stage where the price is expected to surpass the $35,000 range. Furthermore, the Glassnode report suggests that this situation may be related to accumulation above the $30,000 range. The company stated the following in its comments:
During the upward movement above $30,000, this metric reached complete profit saturation for the first time since November 2021, at its all-time high. However, since the drop below $26,000 in recent weeks, over 97.5% of the short-term holder supply has been held at a loss.
According to experts, considering that this level is historically significant, the level at which short-term supply incurs losses is worth considering. It is the level where the probability of sellers being exhausted increases, and it is nearly the same as the level of losses when demand starts to return.

Current Data on Bitcoin!
With the weakening of short-term holder surrender, natural progression suggests that the next outcome should be accumulation. Additionally, the long-term holder position change of Bitcoin has been increasing since September 6 and was at its highest level when this article was written. This development was accompanied by a decrease in whale exits, potentially indicating an accumulation due to whale accumulation starting on September 12. Despite these observations, the realized volatility metric recorded its lowest level on a monthly basis.
This development may indicate that the market is still far from the peak of excitement. However, the accumulation observed by whales and long-term holders may reflect the upward performance that has been dominant since September 12. Consequently, the recent decline in short-term investor profitability may highlight the lower range of short-term selling pressure. The re-accumulation of whales could be considered as evidence of the current market dynamics.

 Türkçe
 Español


