XRP, one of the popular altcoins of recent times, has been attracting attention with its turbulent agenda for the past two months. While preparations are being made for the SEC case by Ripple Labs, many infrastructure service agreements are also being established. Although the selling of XRP by the management may cause criticism from investors, especially if the court process favors Ripple, it may cause the XRP price to reach unimaginable levels. In addition to all these developments, we will examine both the long and short-term support and resistance levels for XRP.
XRP 4-Hour Chart Analysis
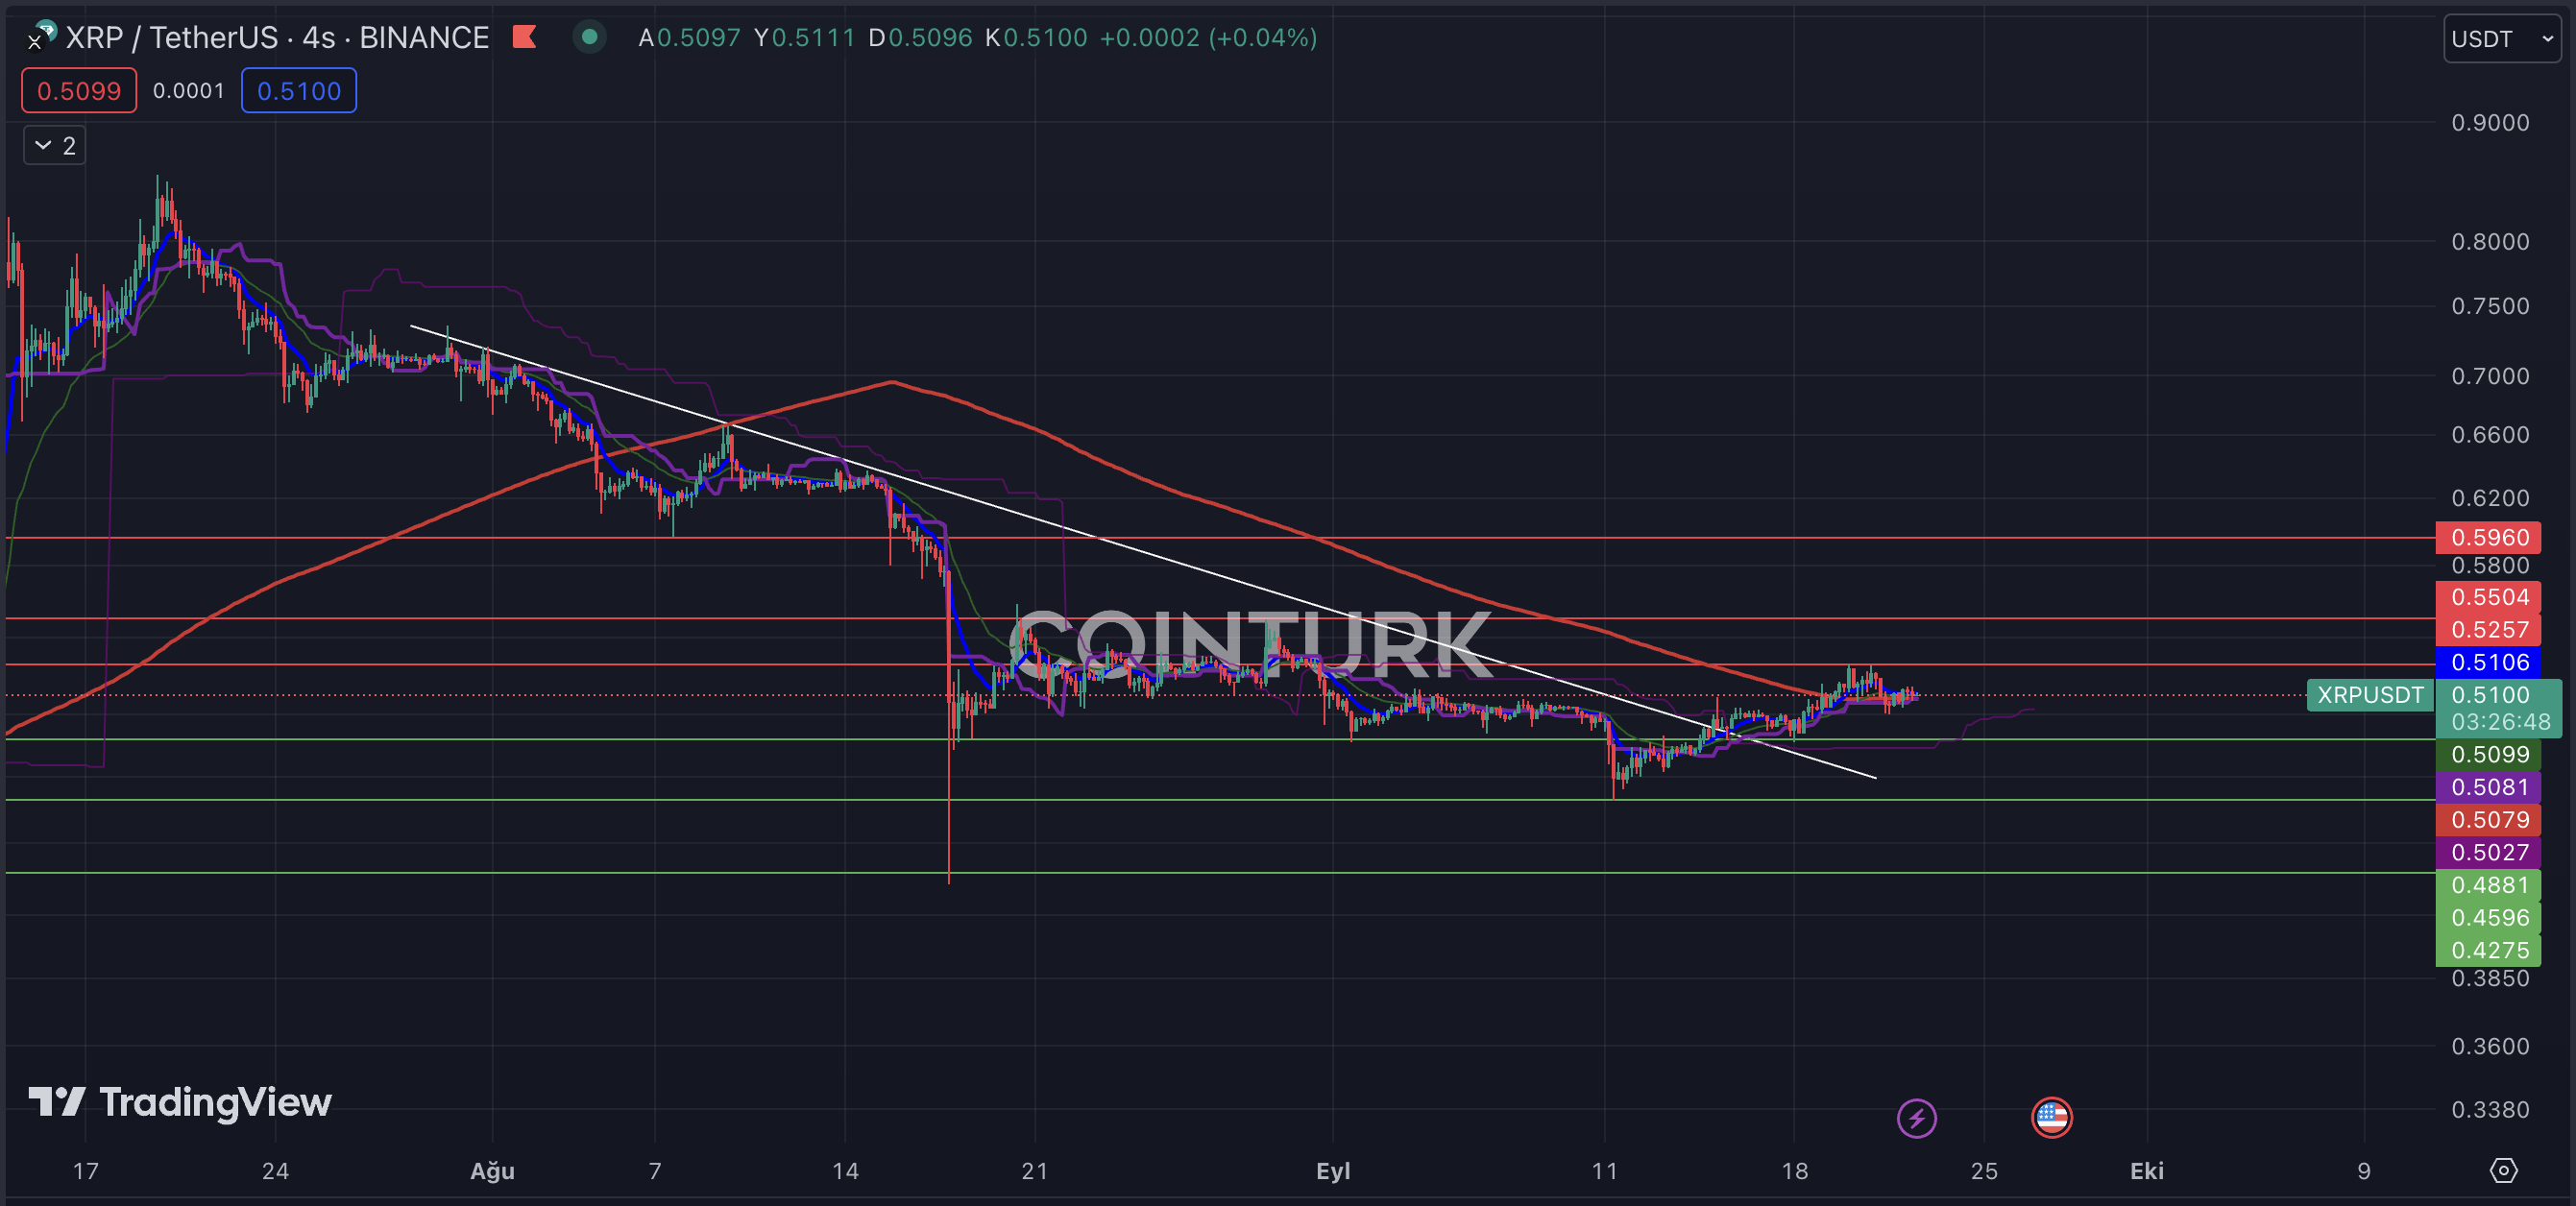
XRP, which has risen by almost 50% after the events on July 17, has now given back all its gains. The high volatility level due to the news flow has not allowed a healthy formation on the 4-hour chart.
However, the drop line drawn from the $0.73 level starting to work as support instead of resistance creates a moderate environment for the XRP price. Also, breaking above the EMA 200 average and the average acting as support is another positive situation.
The resistance levels to be followed for XRP are respectively $0.5257, $0.5504, and $0.5960. Especially, a 4-hour closing above the $0.5257 level, which is the most active resistance in recent times, can greatly support the rise of XRP. The support levels for XRP are respectively $0.4881, $0.4596, and $0.4275. A 4-hour closing below the $0.4275 level can lead to significant declines in XRP.

XRP 15-Minute Chart Analysis
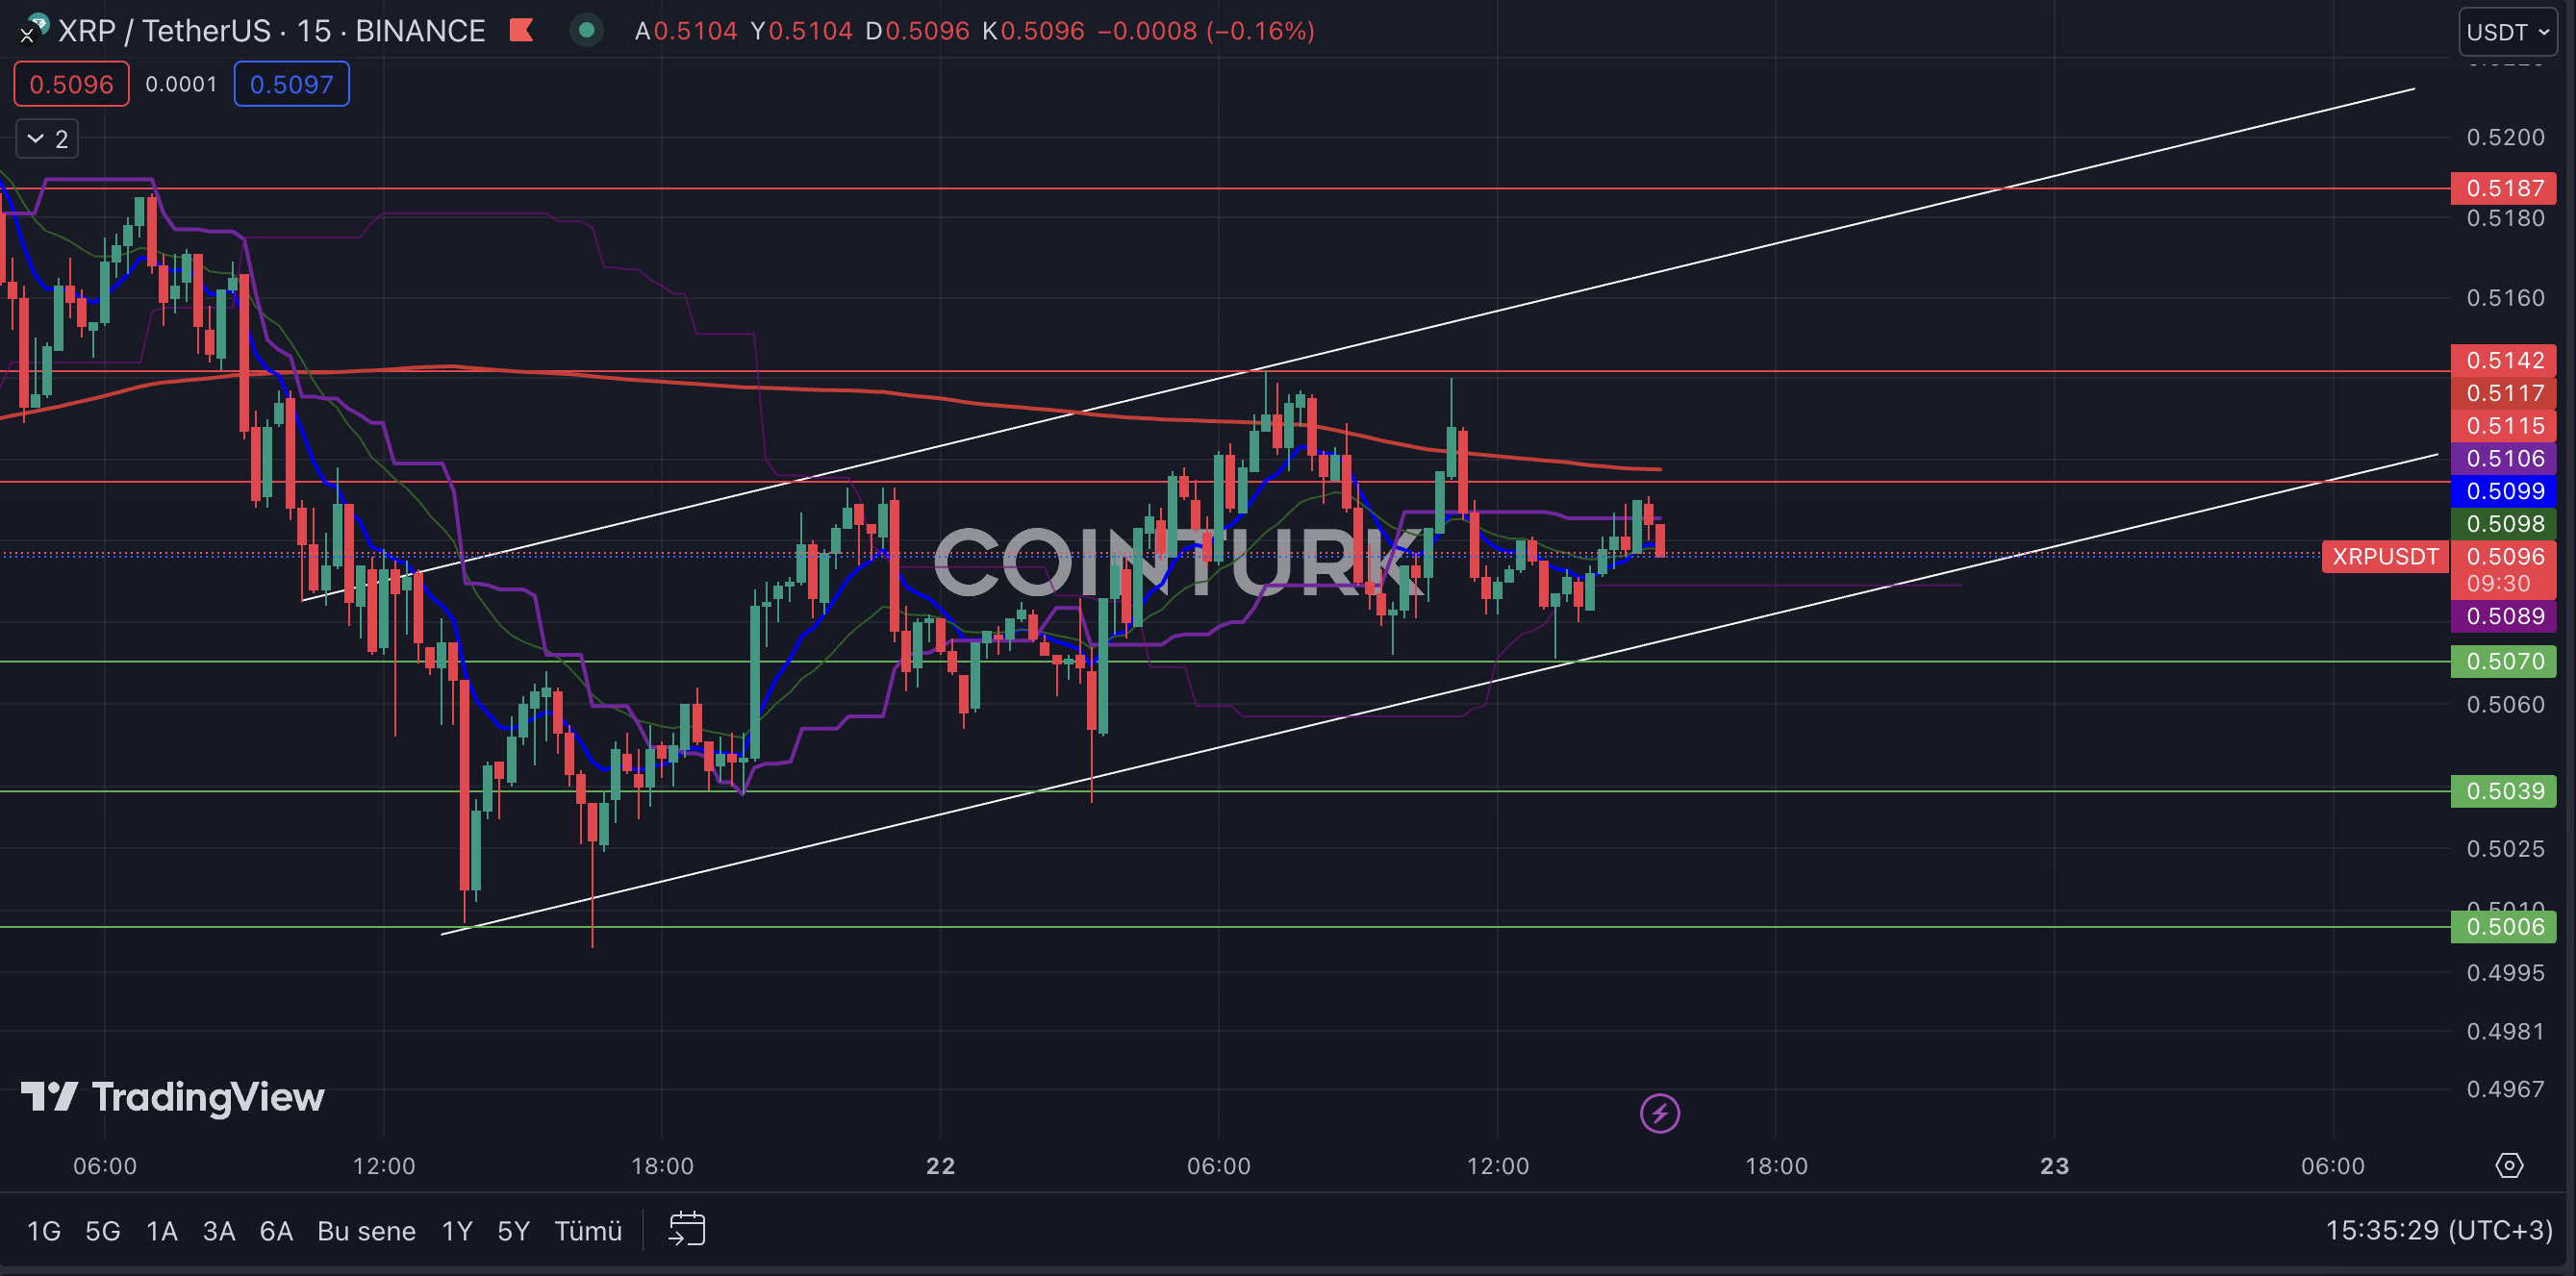
There is a notable formation on the 15-minute chart of XRP. The pinpoint movements of support and resistance points in the rising channel formation make it a formation that futures traders will particularly like.
The price being squeezed in a narrow range and the EMA 200 average squeezing the price in recent bars can trigger a significant rise, especially with positive news. Another positive formation is the support provided by the EMA 21 and EMA 7 levels in recent bars.
The notable support levels on the 15-minute chart are respectively $0.5070, $0.5039, and $0.5006. Especially, a closing below the $0.5070 level will disrupt the formation and deepen the price decline. The resistance levels are respectively $0.5115, $0.5142, and $0.5187.


 Türkçe
 Español


