The cryptocurrency market is seeing many altcoins continue to draw the attention of investors. Recent popular altcoin projects, especially with their rising momentum, continue to please investors. This situation encourages users in blockchain projects and leads to increased activities within the ecosystem. So, what’s happening with Cardano, Avax, and Dogecoin lately? Let’s take a look.
Cardano Chart Analysis
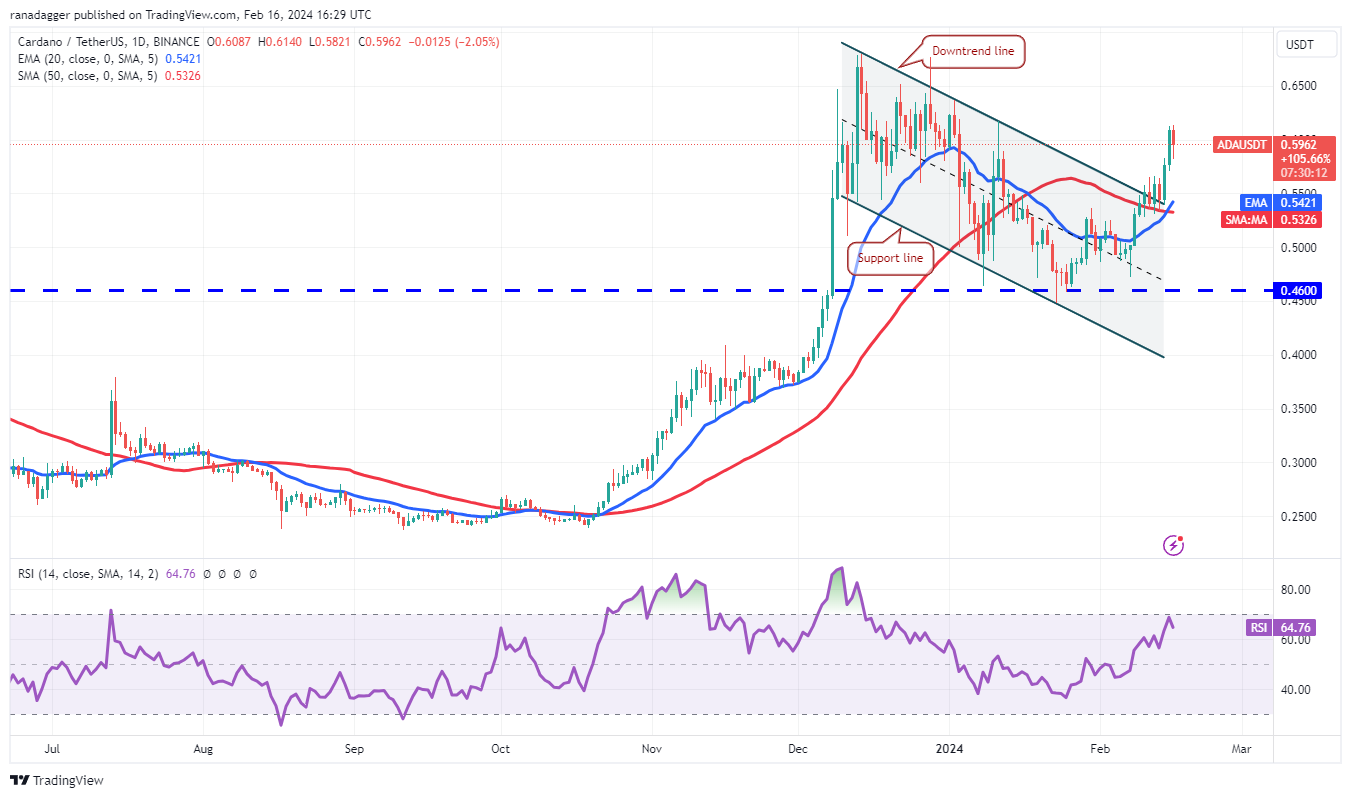
After struggling for a few days, Cardano gained momentum on February 14th, breaking above the sudden resistance level of $0.57. The rising 20-day EMA level at $0.54 and the RSI in the positive zone indicate a slight advantage for buyers. There’s a minor resistance at $0.62, but it is likely to be surpassed. The ADA/USDT pair could then climb to the strong general resistance at $0.68.

On the downside, the important support to watch is at the moving averages. A break and close below the 50-day SMA level of $0.53 would indicate that the recent breakout could have been a bull trap. The pair could then drop to the solid support at $0.46.
Avax Chart Analysis
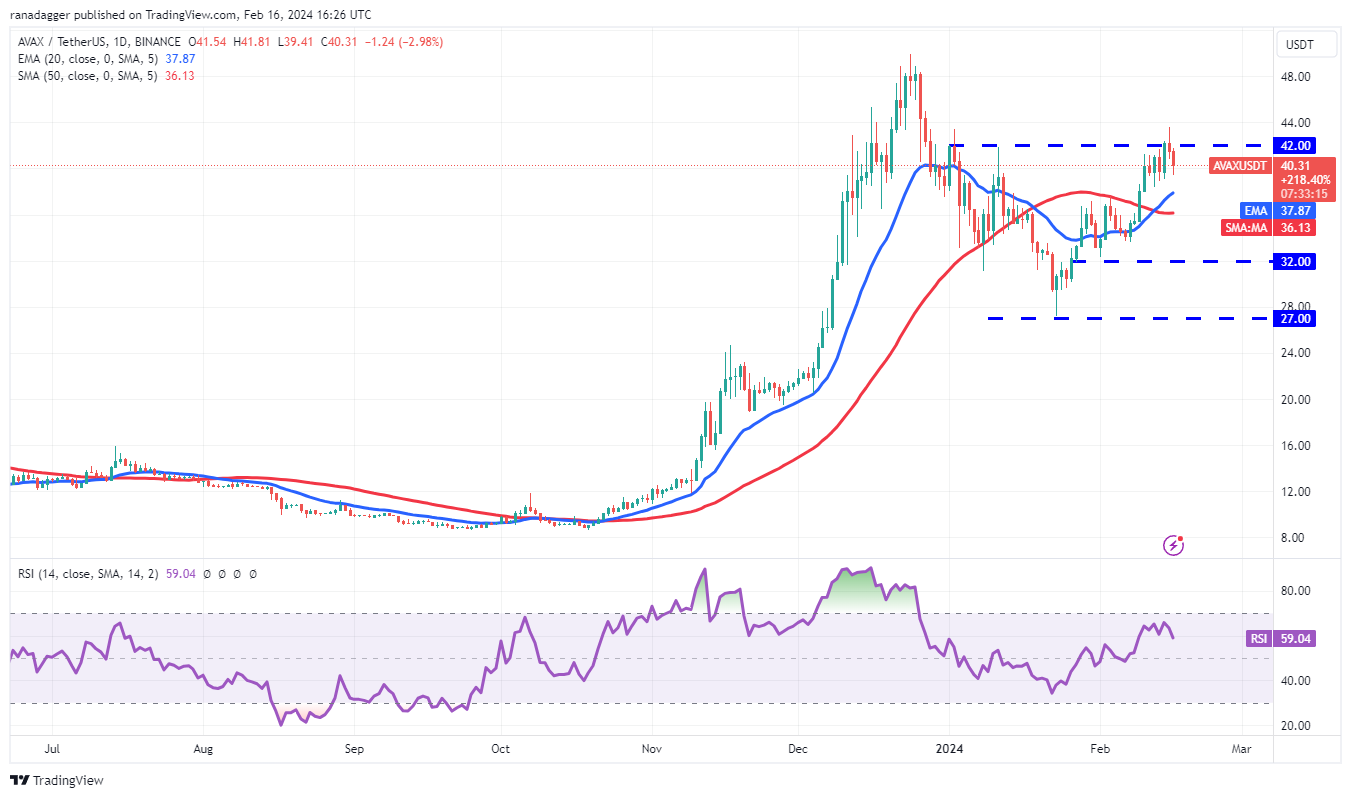
Buyers pushed Avax above the $42 peak resistance but failed to sustain higher levels as seen from the long wick on the February 15th candlestick.

The price could drop to the first support line, the 20-day EMA level at $37.87. If the price rebounds from the 20-day EMA level, the likelihood of breaking above $42 increases. If this occurs, the AVAX/USDT pair could trigger a rally towards $50 by completing a reverse head and shoulders bullish formation.
Conversely, if the price continues to fall and drops below the moving average, the pair could be expected to trade between $32 and $42 for a while.
Dogecoin Chart Analysis
Dogecoin turned upwards from the 20-day EMA level of $0.08 on February 14th, breaking above the downtrend line and indicating buyers’ attempt to take control. If the price stays above the downtrend line, the DOGE/USDT pair is likely to gain momentum and rise towards the resistance zone between $0.10 and $0.11. A strong defense by sellers is expected in this area.

Alternatively, if the price falls and drops below the 20-day EMA level, it would indicate that each high level is being sold off. The pair could then fall to the rising trend line and subsequently to the strong support at $0.07.


 Türkçe
 Español


