The recent increases in the cryptocurrency market have revitalized the altcoin market. Notable performances in many cryptocurrencies, including Solana, Ripple, and Bitcoin, continue to be discussed. So, what is happening with meme token projects, which are the favorites of investors? Let’s examine the charts of Shiba Inu, Dogecoin, and Floki.
Shiba Inu Chart Analysis
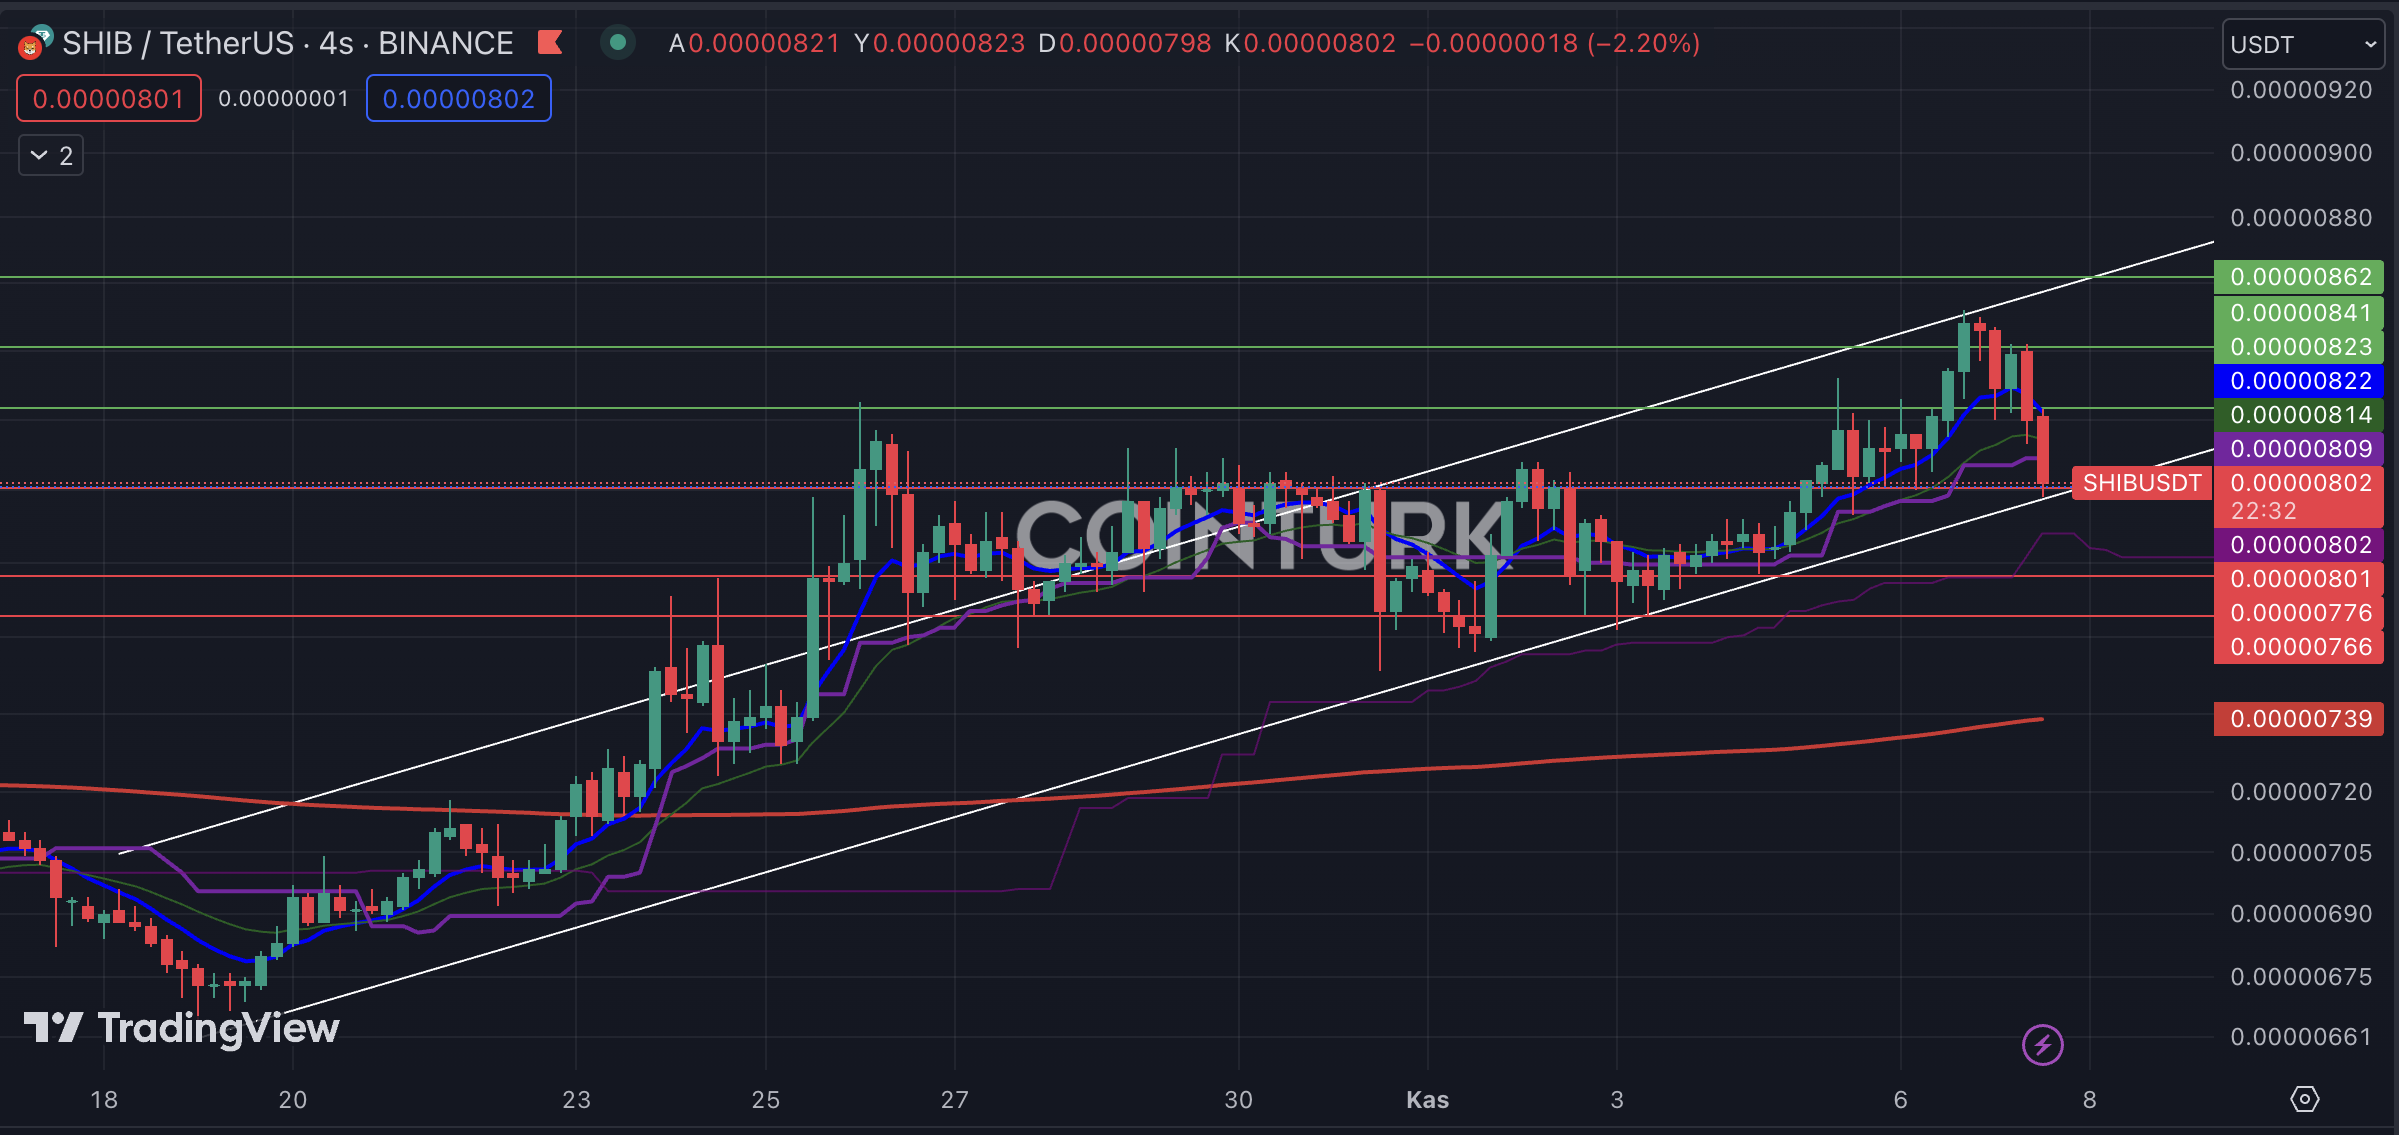
The first notable formation structure on the four-hour chart of Shiba Inu is the ascending channel formation. With the recent decline, there was a support test in the SHIB market. Additionally, breakouts in the resistance line are noteworthy as bull traps, while there has been no breakout in the support line so far.
The support levels that need to be considered for SHIB on the four-hour chart are respectively; $0.00000801, $0.00000776, and $0.00000766. Especially, if the bar closes below the $0.00000801 level, it will cause the breakdown of the ascending channel formation. The resistance levels that need to be followed for SHIB are respectively; $0.00000823, $0.00000841, and $0.00000862.

Dogecoin Chart Analysis
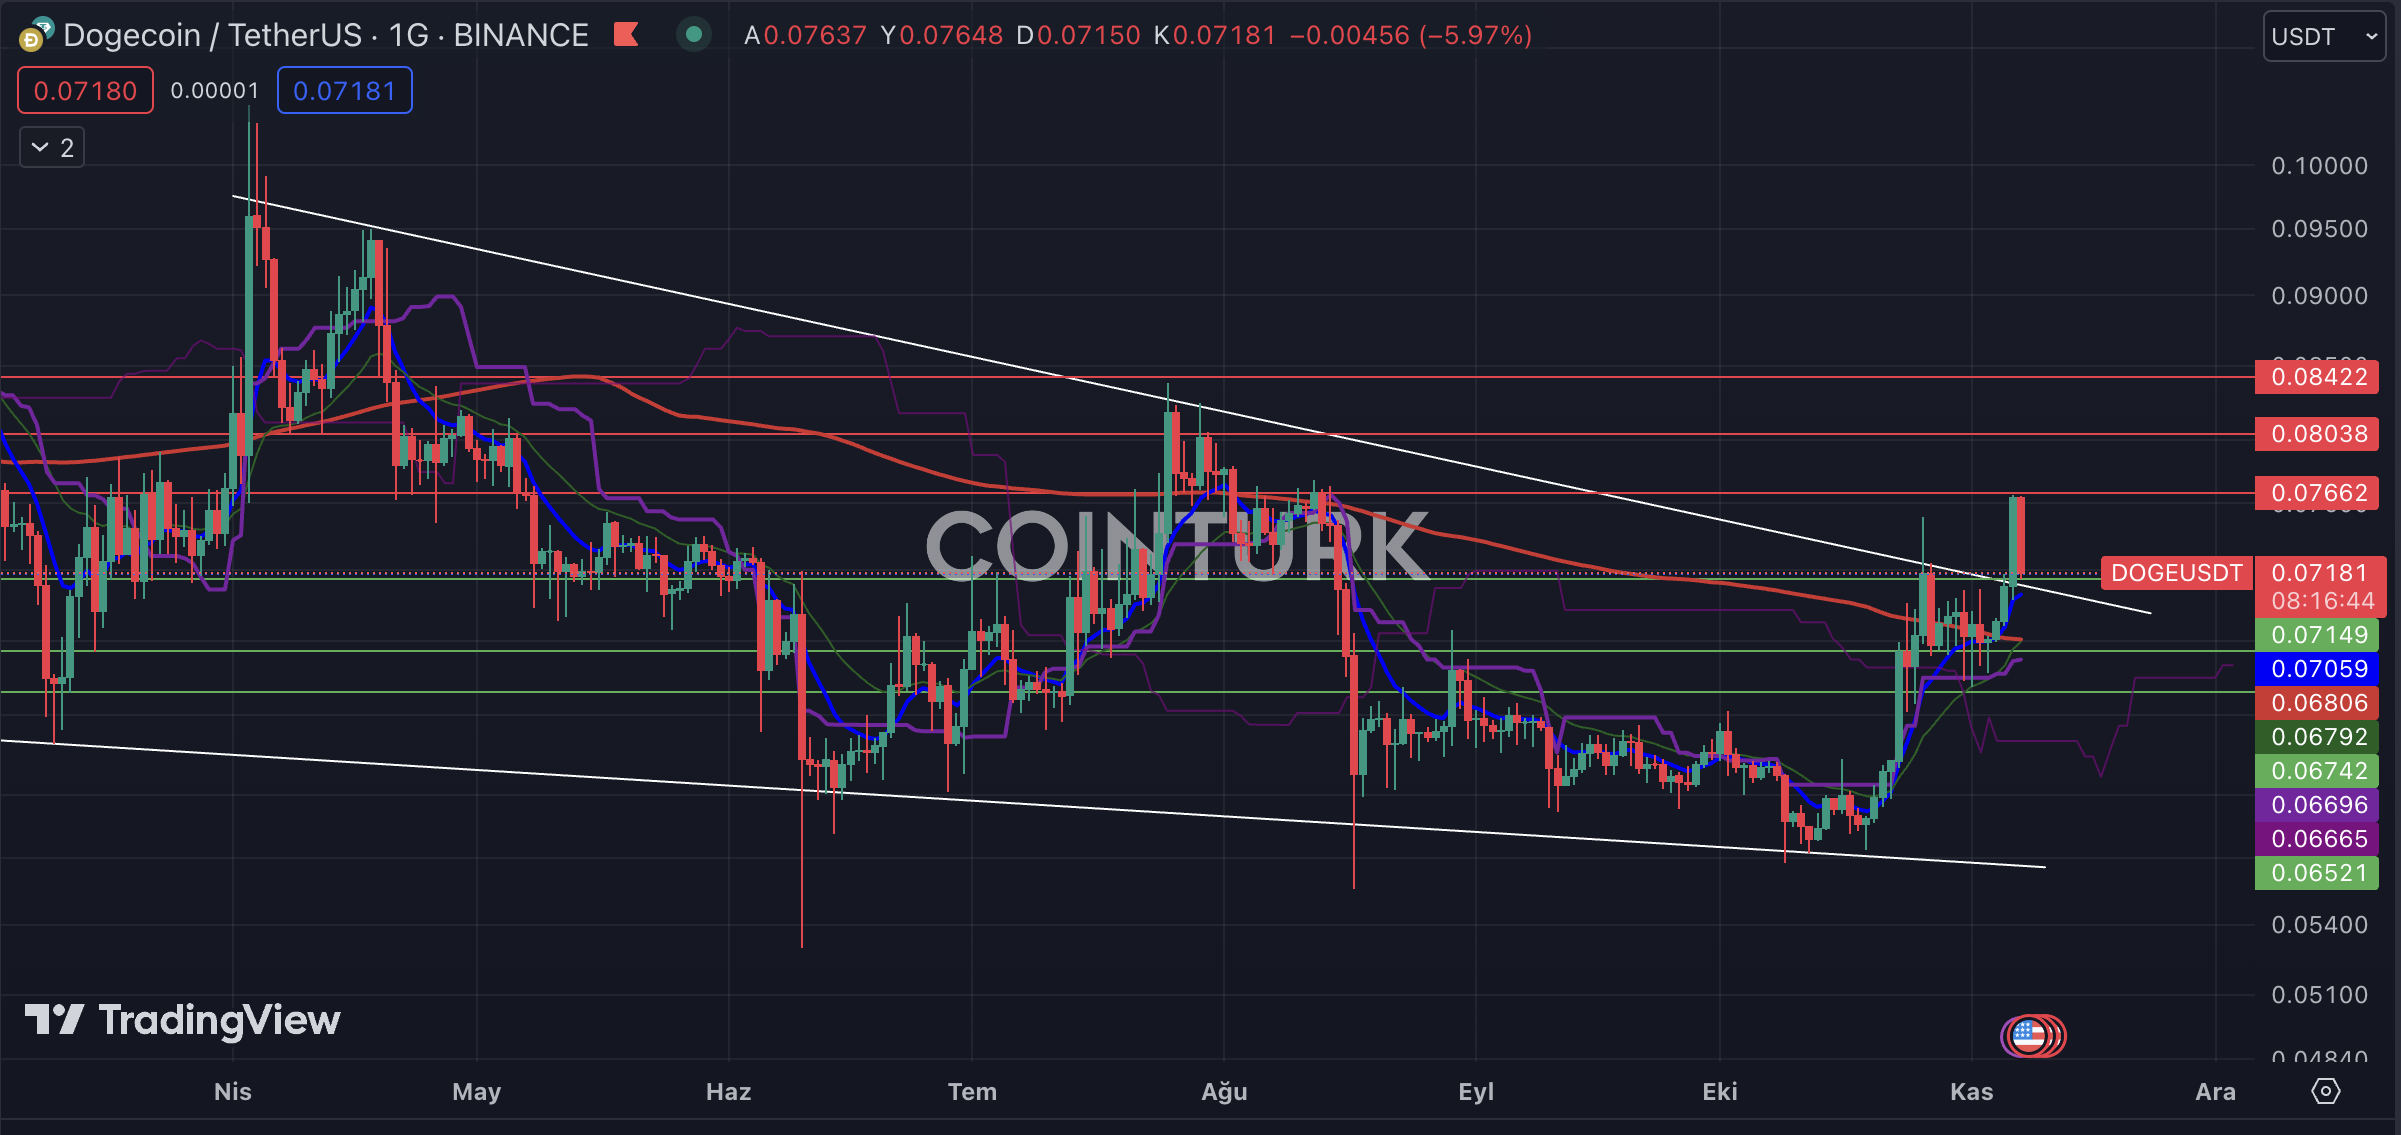
The first formation that stands out on the daily chart of Dogecoin is the contracting wedge formation. According to this, the breakout of the resistance line finally occurred in the formation structure that has been ongoing since April, and today the resistance line acted as a support line. This situation will enable DOGE price to gain strength.
The important support levels that need to be considered for DOGE on the daily chart are respectively; $0.07149, $0.06742, and $0.06521. Especially, if the daily bar closes below the $0.07149 level, it may invalidate the formation breakout. The resistance levels that need to be followed for DOGE are respectively; $0.07662, $0.08038, and $0.08422.

Floki Chart Analysis
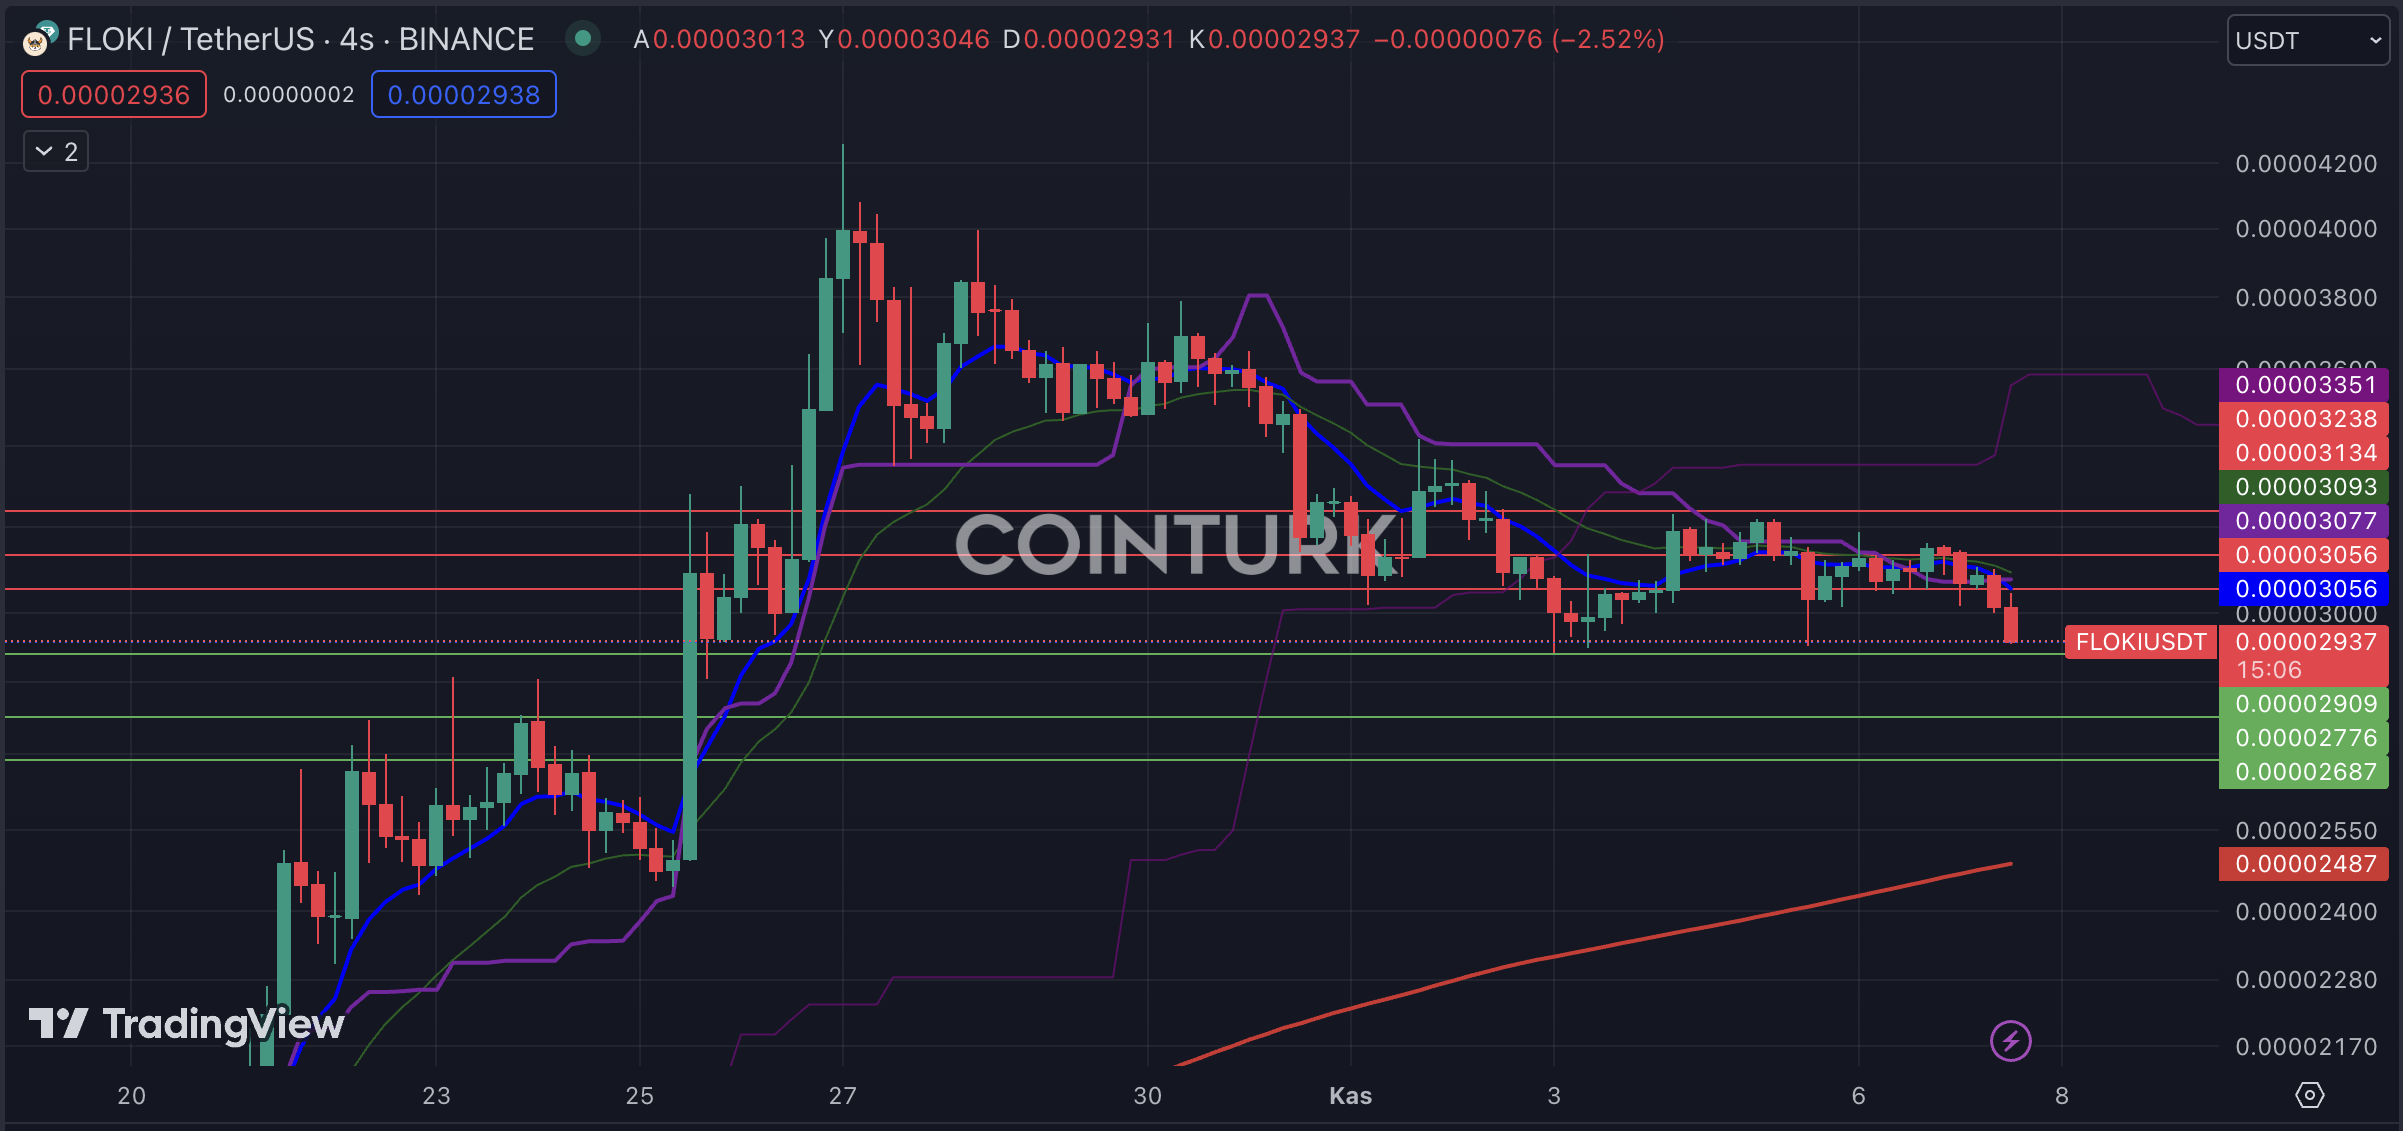
Another popular meme token project among investors, Floki, continues to lose value after the recent increase. If the bar closes below the EMA 7 and EMA 21 levels on the four-hour chart, it can further trigger the price decline.
The support levels that need to be considered for Floki are respectively; $0.00002909, $0.00002776, and $0.00002687. Especially, if the bar closes below the $0.00002909 level, it may accelerate the downward movement. The resistance levels that need to be followed for Floki are respectively; $0.00003056, $0.00003134, and $0.00003238.


