Bitcoin recently encountered significant selling pressure, falling below the $45,000 level. This downturn followed a negative development in the ETF process and the release of macroeconomic data in the United States on January 11. On the night of January 11, a fake approval announcement on the official SEC page X caused concern among investors.
Bitcoin Technical Analysis
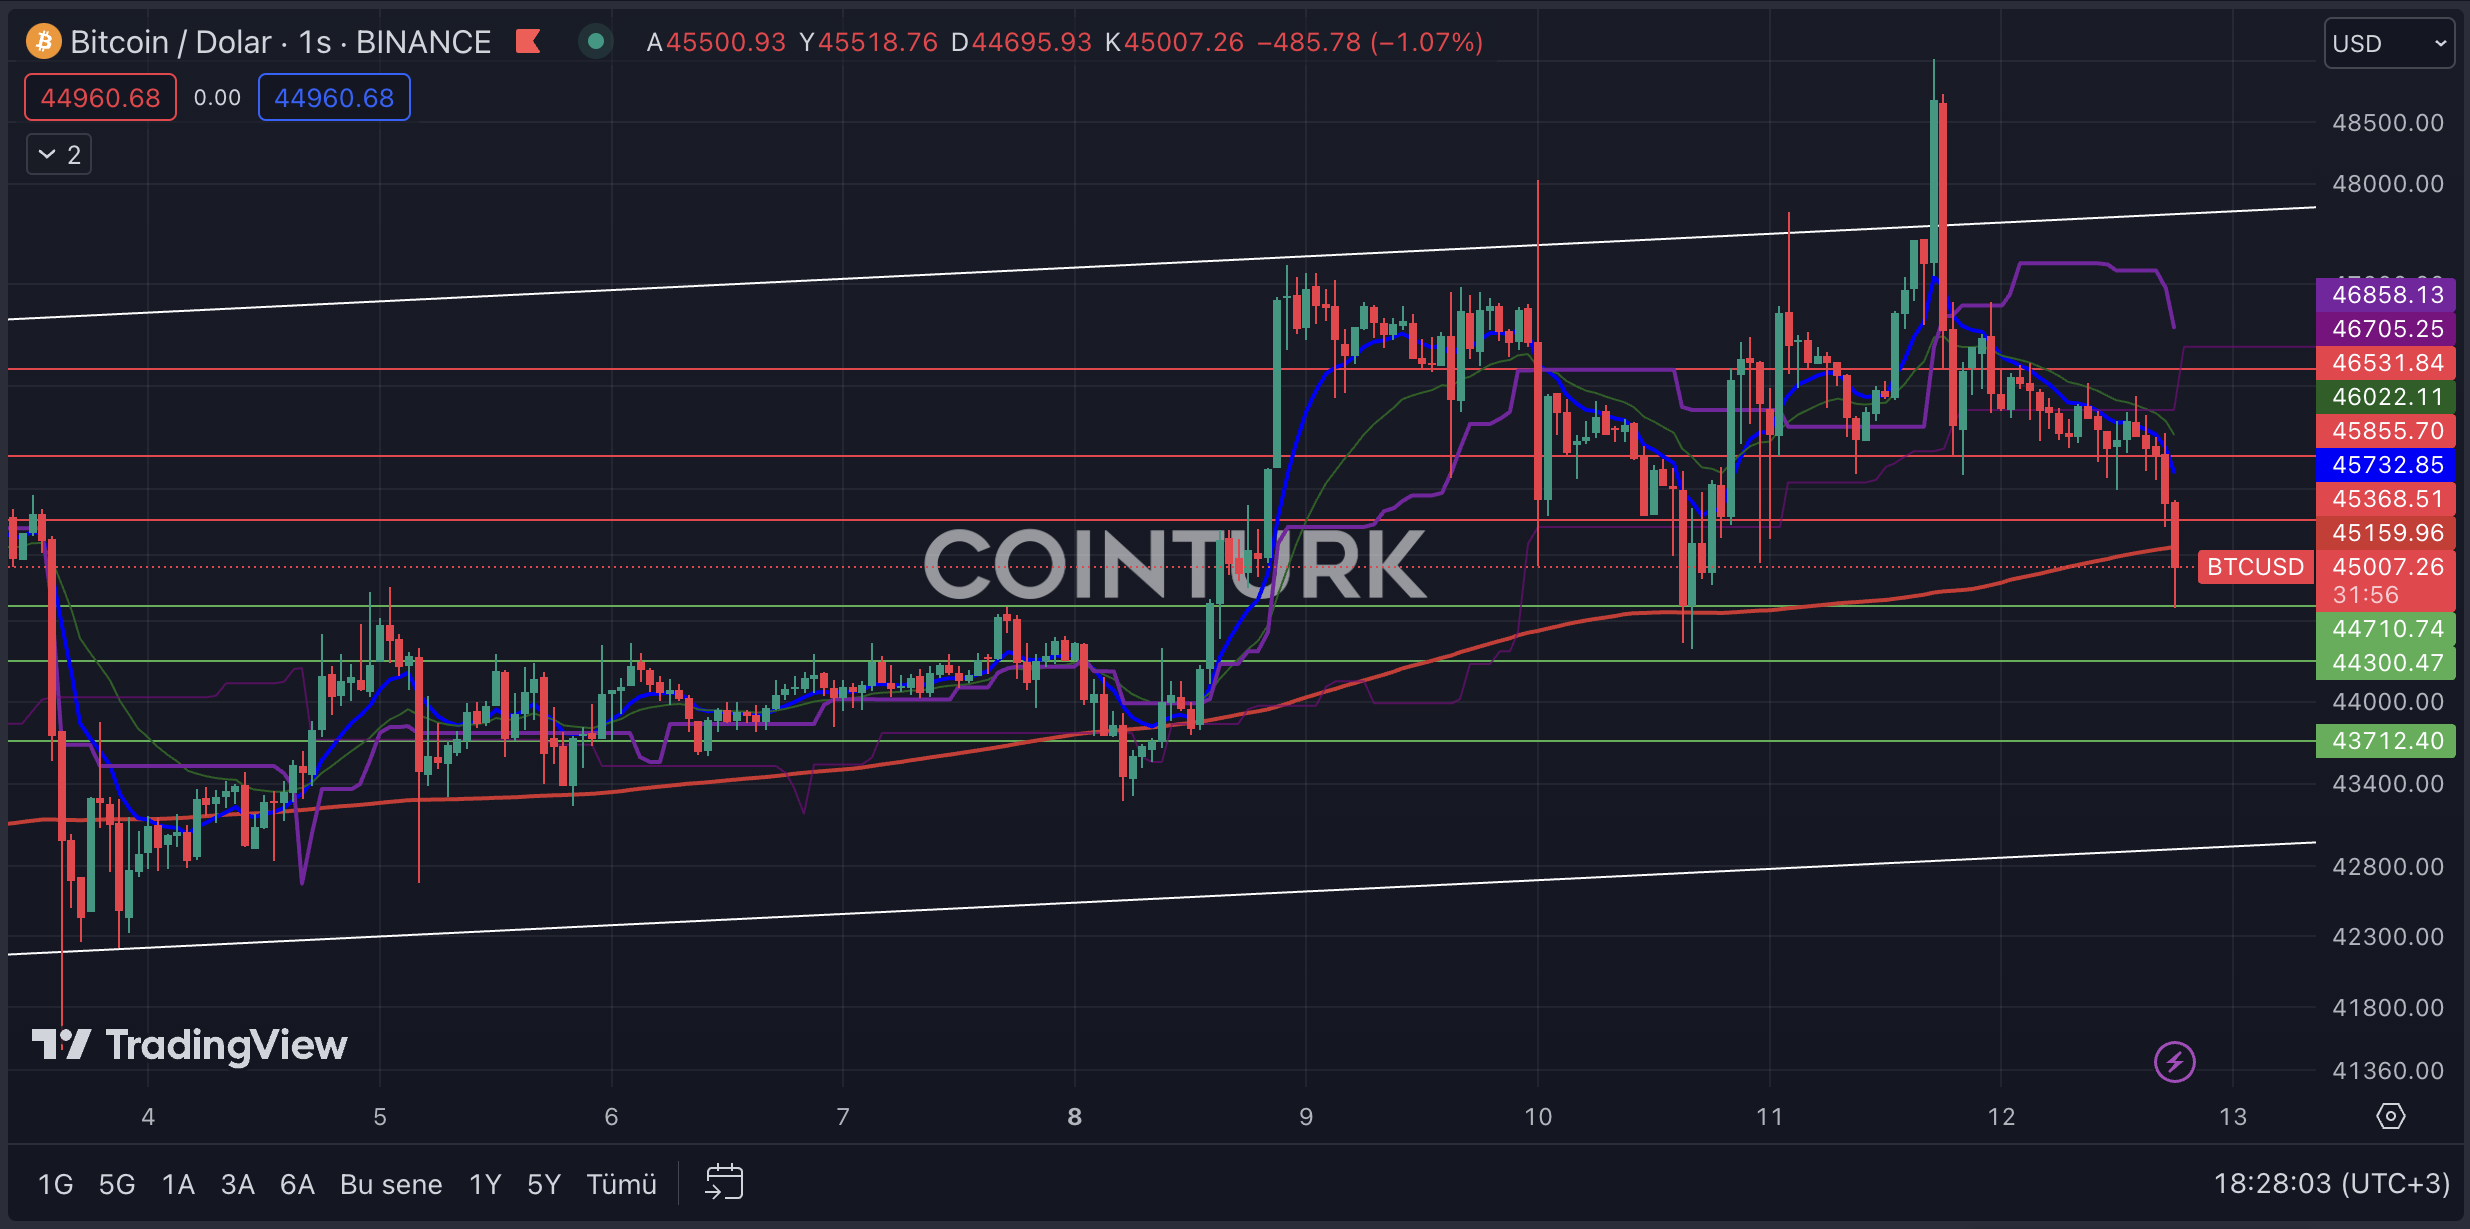
At the time of writing, Bitcoin had retreated to the $45,007 level, previously attracting attention with its rising channel formation. After rising to the $49,000 level following the opening of Wall Street in the US on January 11, Bitcoin managed to break the resistance in the formation structure, but this move remained a bull trap, leading to losses for many investors.
The most important support levels to watch on the hourly chart for Bitcoin are; $44,710 / $44,300 and $43,712, respectively. A close below the $44,710 level, in particular, could increase selling pressure on the Bitcoin front.
The most important resistance levels to monitor on the hourly chart for Bitcoin are; $45,368 / $45,855 and $46,531, respectively. A close above the $45,855 level, especially where it intersects with the EMA 21 level (blue line), could help alleviate selling pressure on Bitcoin.


 Türkçe
 Español


