Anonymous crypto analyst TechDev summarized the possible path that the crypto king Bitcoin (BTC) could follow, stating that the recent drop in Bitcoin, based on historical data, could be a misleading price movement before the start of a new macro bull run. Here is the analyst’s commentary on BTC.
Bitcoin’s Most Likely Scenario and Target Levels
Experienced crypto analyst TechDev suggests that if past cycles are an indication of the future, Bitcoin’s recent drop to $25,000 could serve as a springboard for a new rally, stating, “In the coming months, it will either surprise the market once again, or this time it is truly different.”
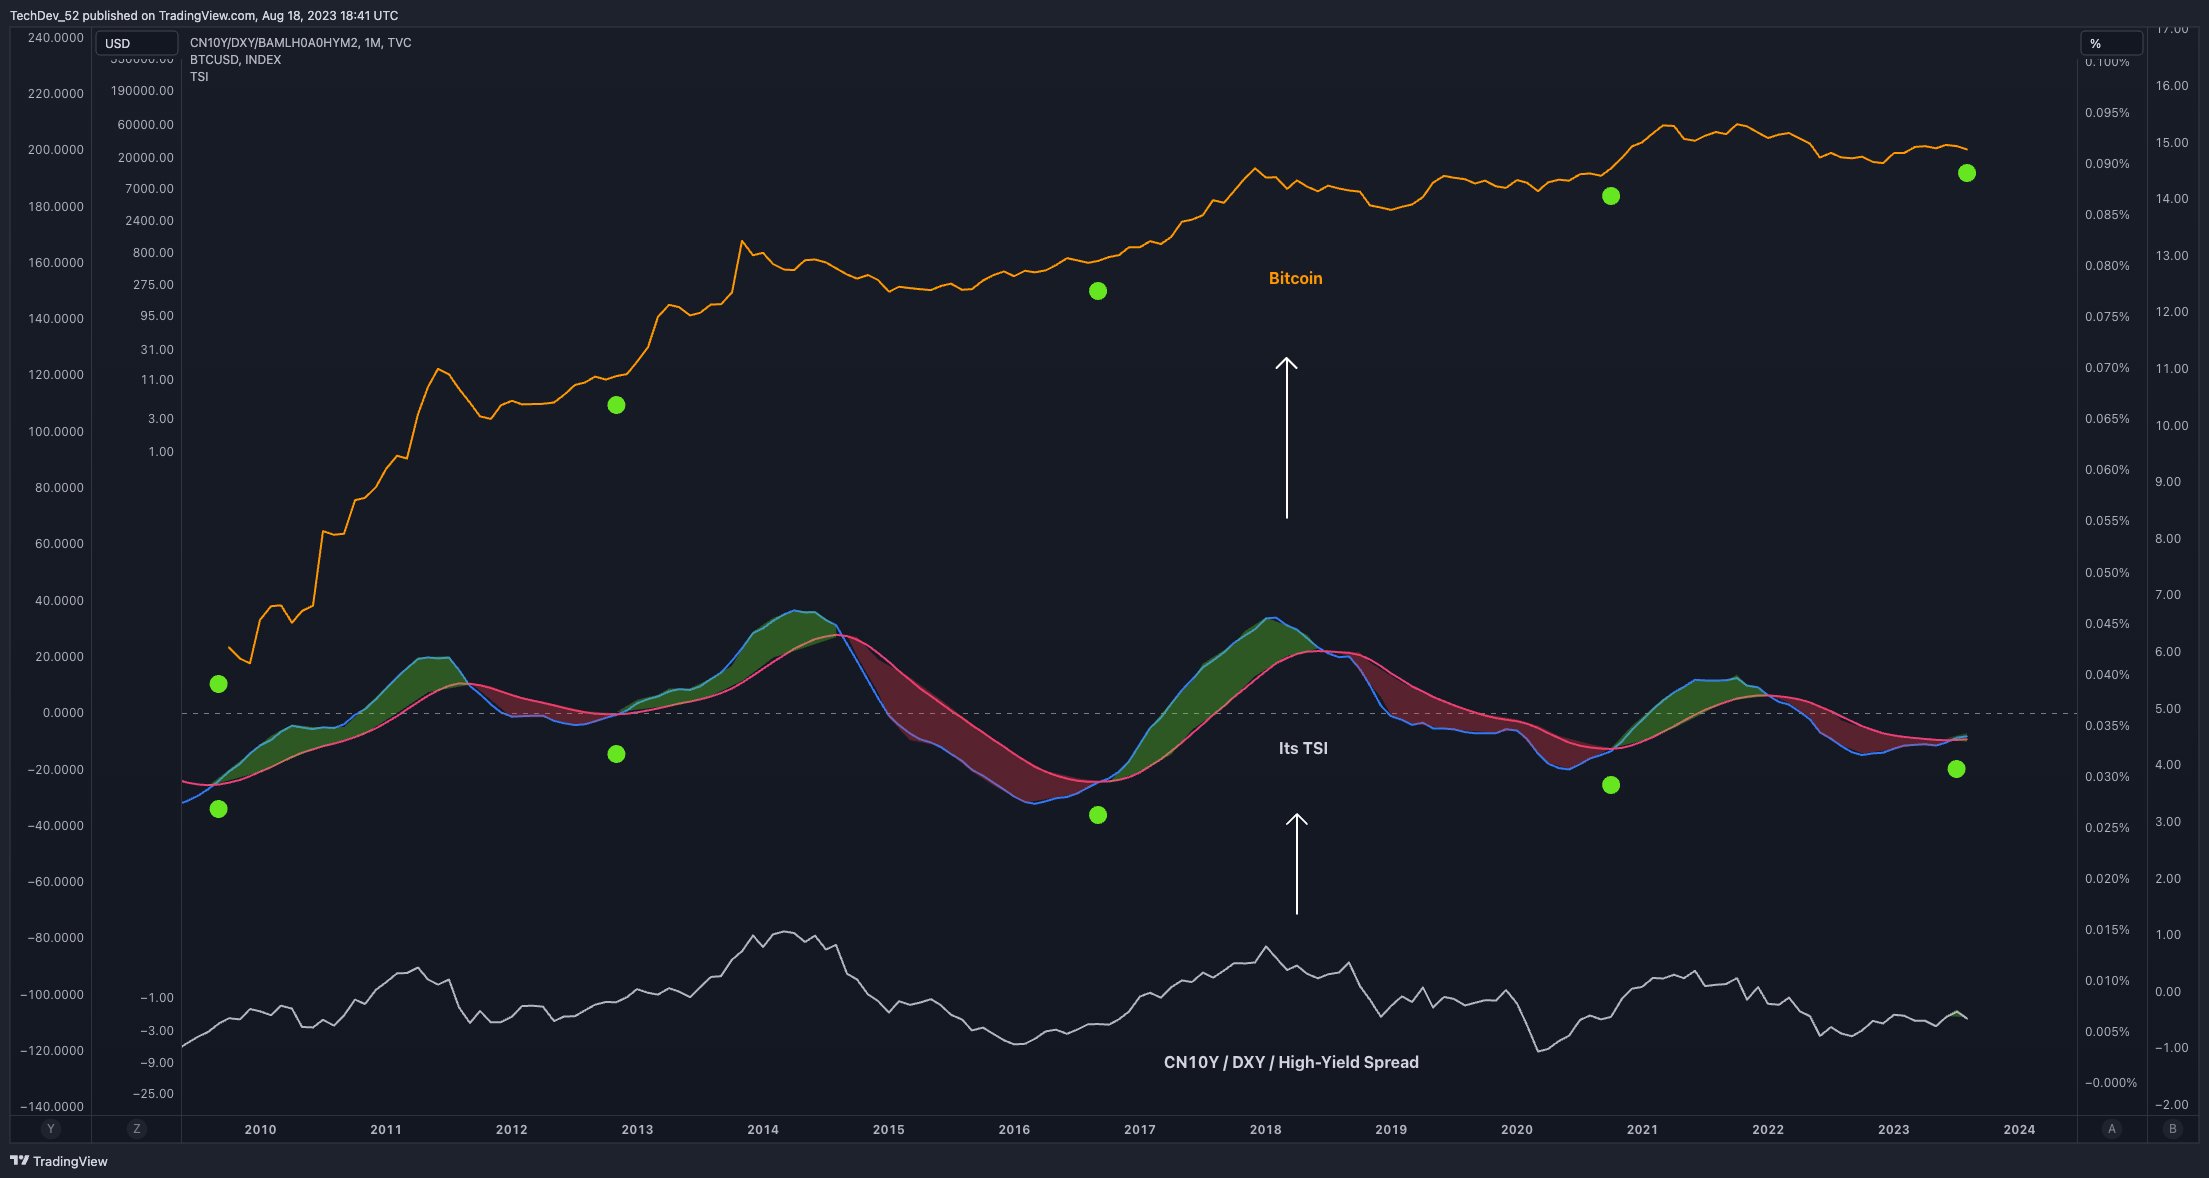
The analyst closely monitors global liquidity cycles by comparing China’s 10-year bonds (CN10Y) with the US dollar index (DXY). The graph shared by TechDev uses the True Strength Indicator (TSI) to measure the momentum of CN10Y against DXY, which indicates a breakout movement signaling a bull market, a technical reading present at the start of bull markets. The analysis presented by the analyst is based on the Supertrend indicator, which generates bull and bear signals based on whether the price surpasses previous opening or closing levels during a specific period.

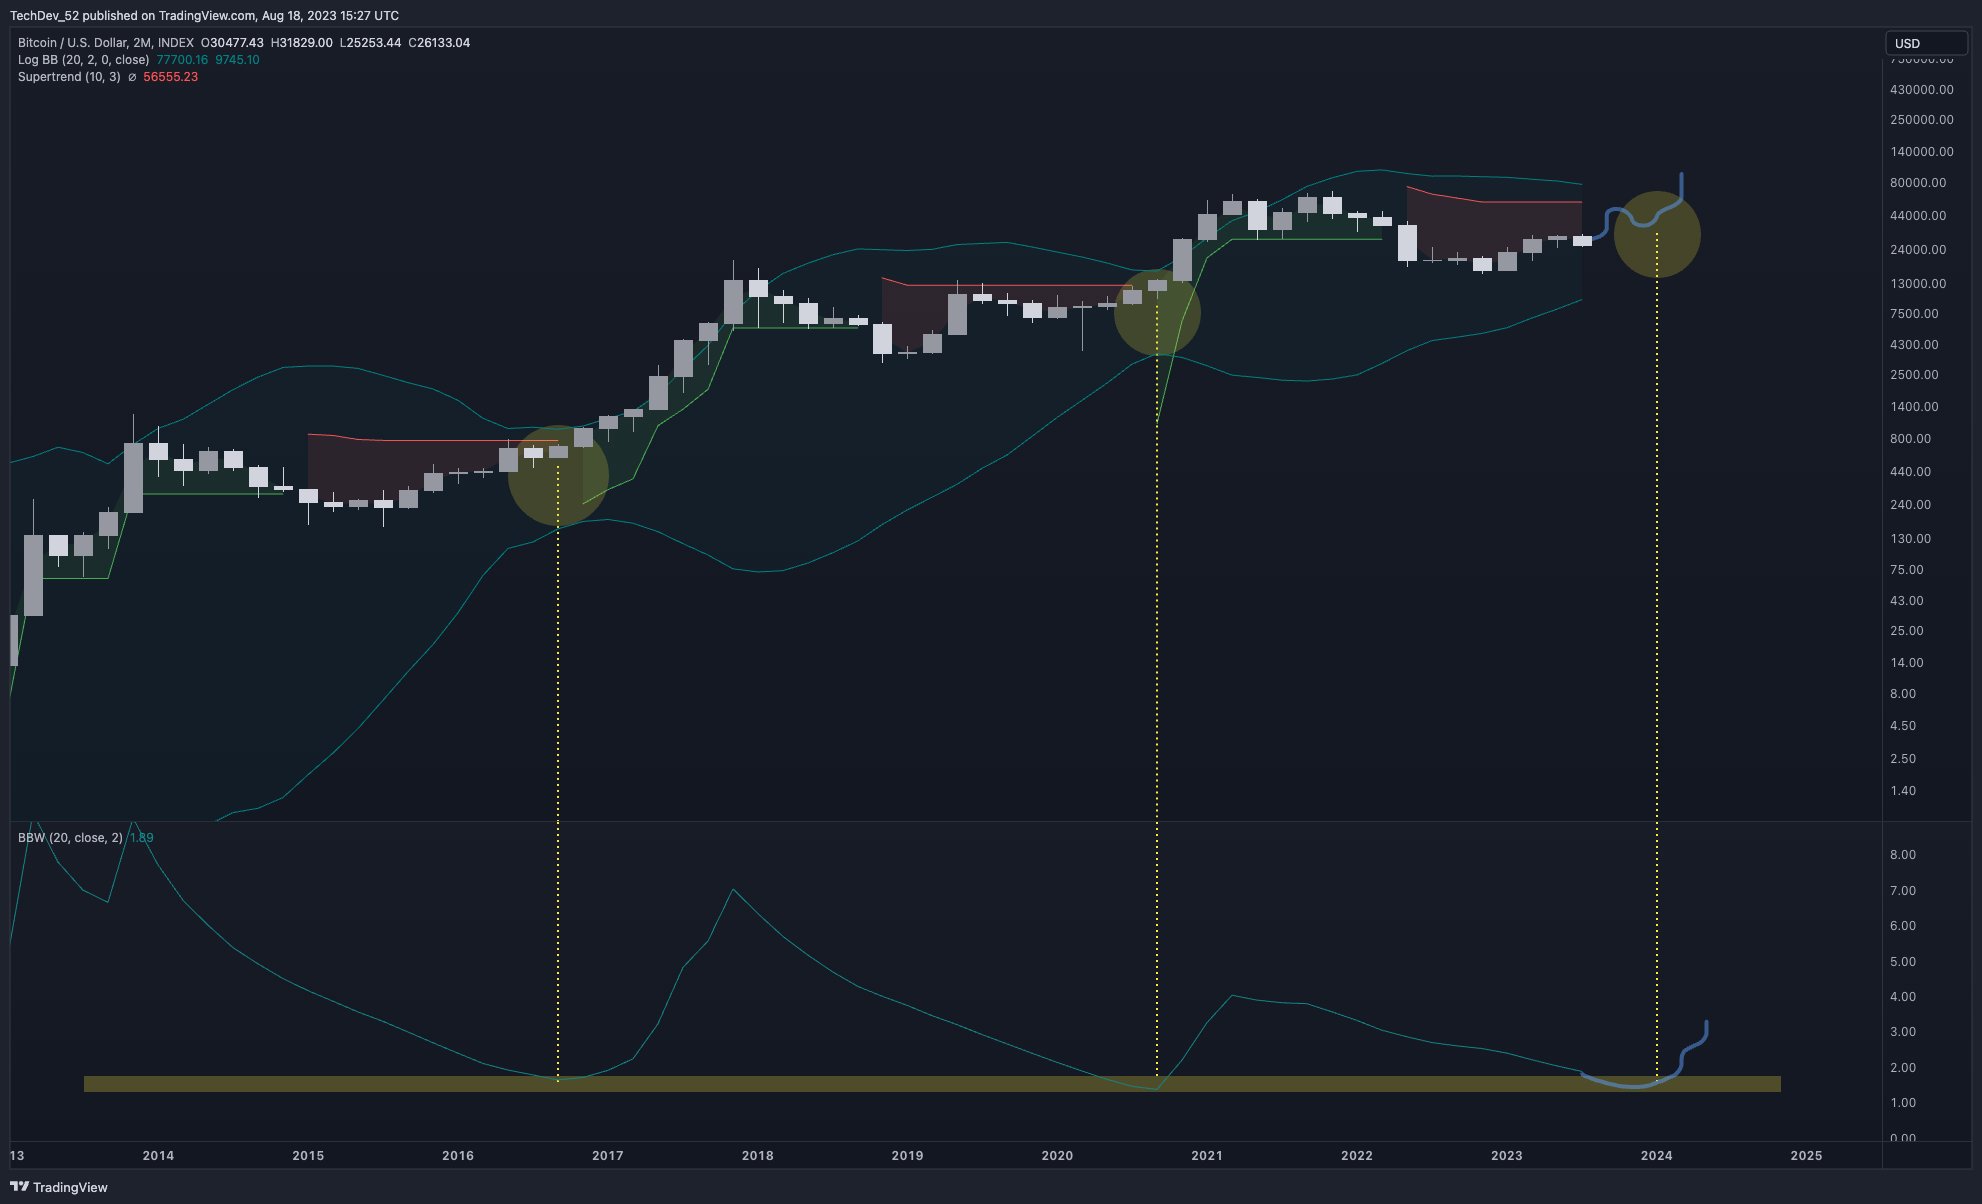
The most positive scenario presented by the analyst for Bitcoin is a rise to the approximately $50,000 Supertrend level represented by the red line on the graph, followed by a support test around $30,000, and then the start of a parabolic rise. According to TechDev, these price movements will cause Bitcoin’s two-month chart to fall into the support area of the Bollinger Bands Width (BBW) indicator. In the past, this level signaled the beginning of bull markets in 2017 and 2020.
While investors use the BBW indicator to measure the volatility of an asset, TechDev stated, “I expect to see a movement in the two-month Supertrend + a retest to complete the two-month consolidation.”

Gaussian Channel Indicates an Upside Signal for Bitcoin
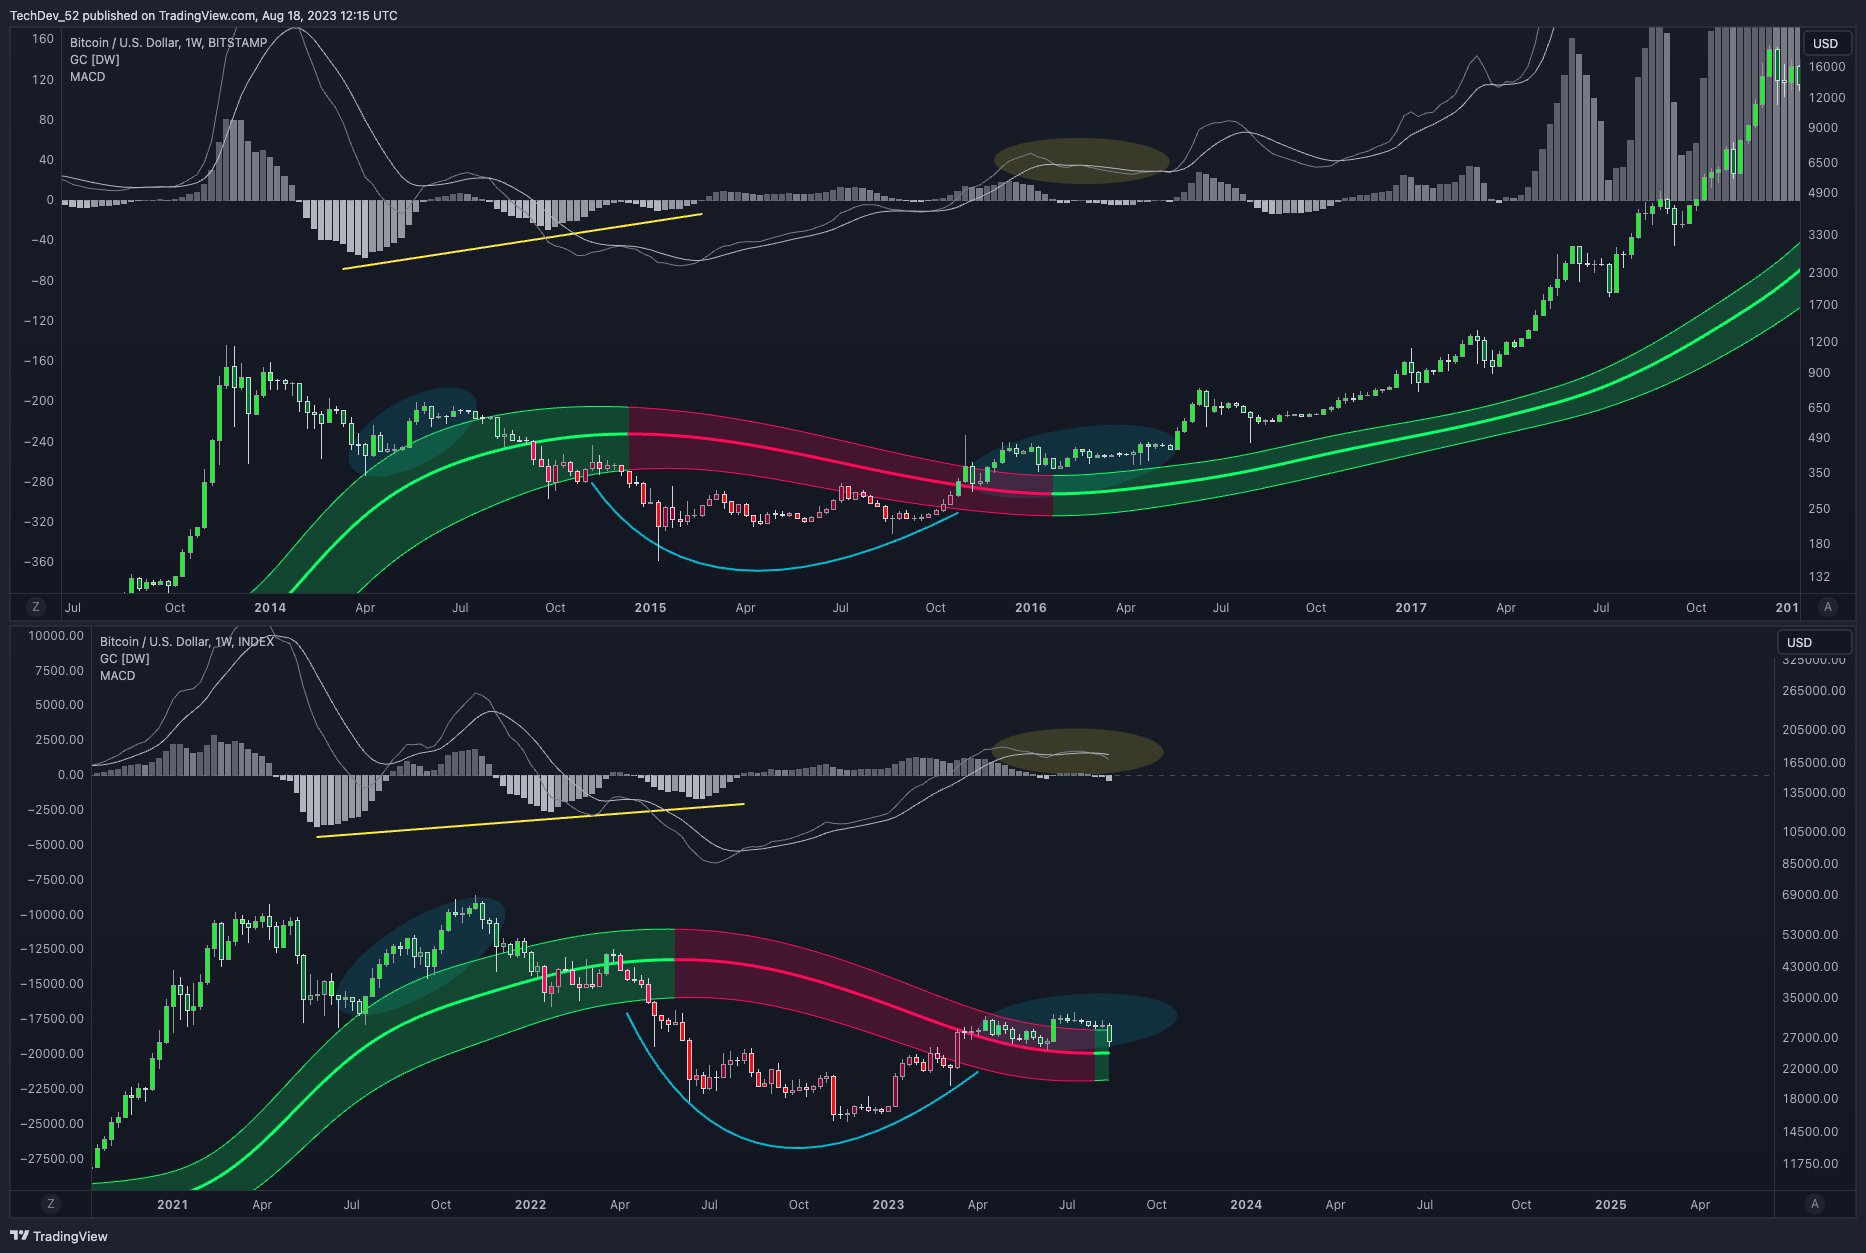
TechDev also compared the present time with the period between now and 2016 using the Gaussian Channel. According to this comparison, Bitcoin had consolidated by spending several months above the Gaussian Channel and testing it as support in 2016, and then entered a clear uptrend. Based on the comparison, TechDev expects Bitcoin to repeat the recovery seen in 2016, consolidate for an extended period just above the Gaussian Channel, and then reach an all-time high.
The Gaussian Channel is an indicator that attempts to define the trend of an asset, and TechDev stated that Bitcoin should stay above the center of this channel.


 Türkçe
 Español


