The leading cryptocurrency, Bitcoin (BTC), saw its momentum wane after crossing the $50,000 threshold. The price of the cryptocurrency was fluctuating within a range, which could indicate a slower pace in the coming days.
Resistance Zone for BTC
In the last 30 days, the price movement of BTC has once again slowed down after growing by approximately 30%. This can be seen from the significant price movements in the last few days. At the time of writing, BTC is trading at $50,948.23 with a market value of over 1 trillion dollars. Coinglass’s latest tweet also highlighted that the BTC price has been moving between $52,000 and $50,500.
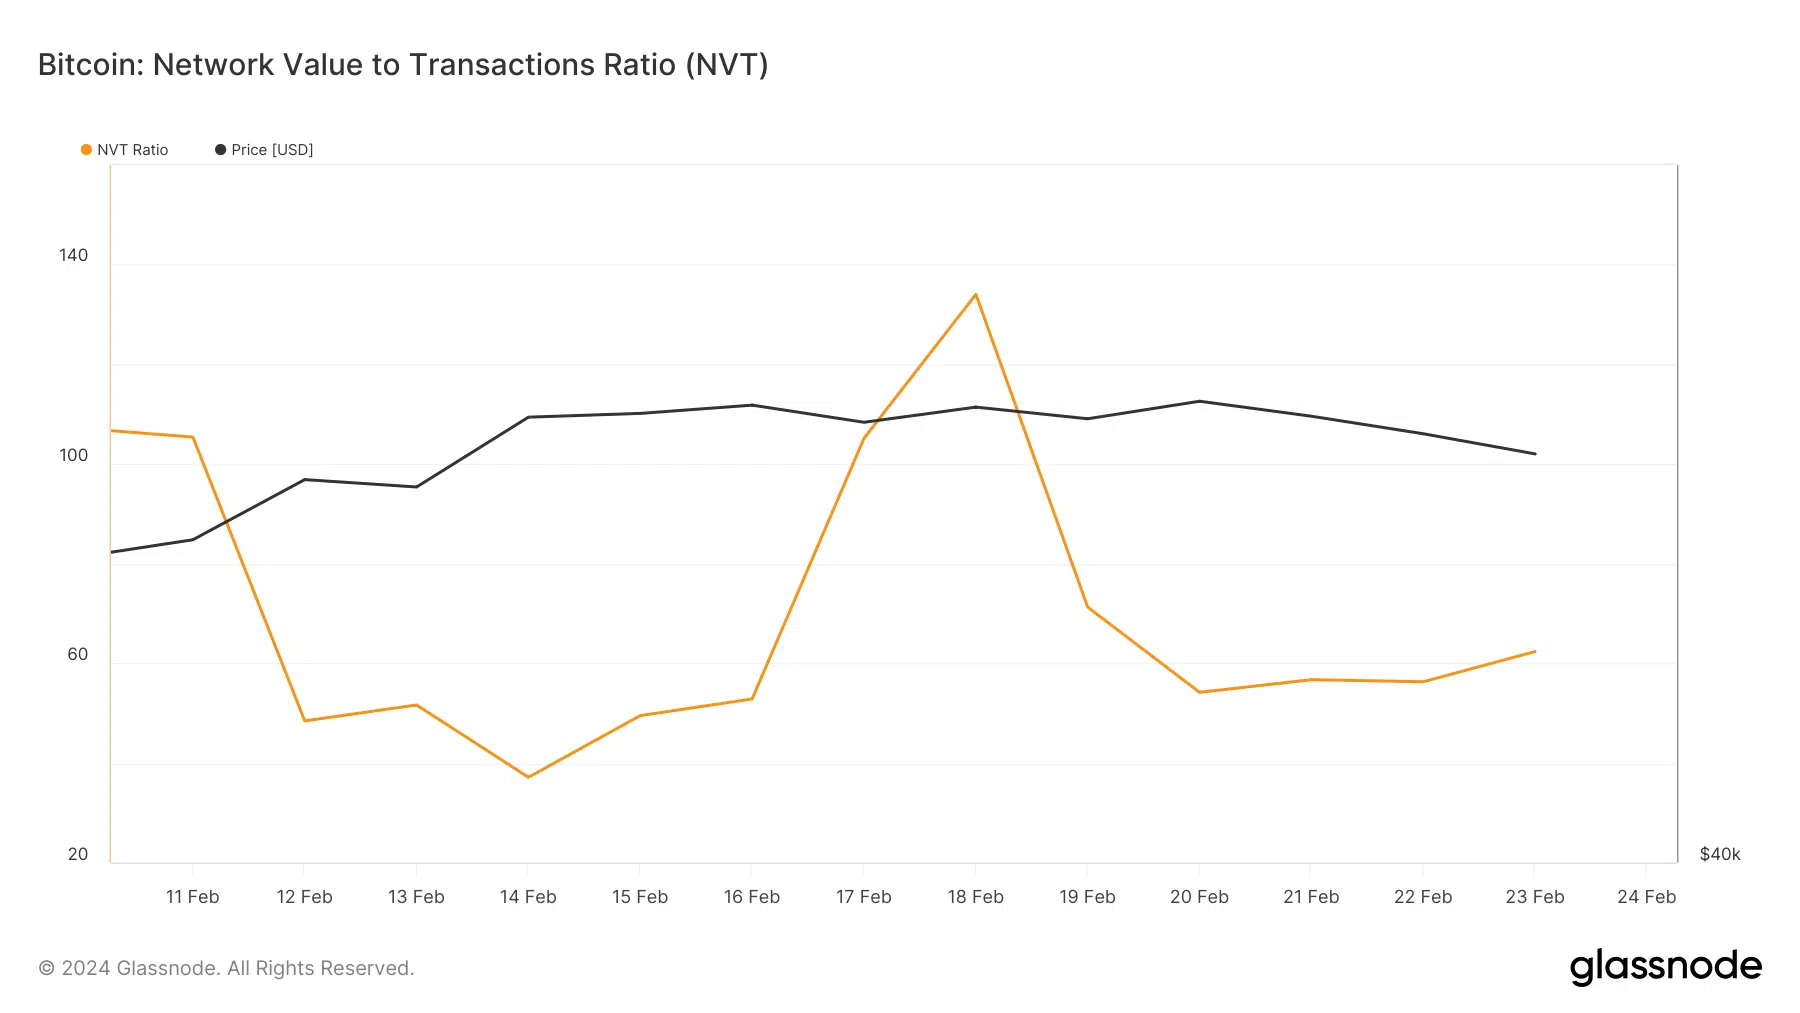
The mentioned levels also serve as BTC’s resistance and support levels, respectively. If BTC’s price manages to break through the resistance zone, it could likely touch $55,000. However, if the opposite occurs and BTC falls below the support zone, investors may witness a further downward trend. We have observed a decline in BTC’s network value to transactions (NVT) ratio over the last few days.

Bitcoin Exchange Reserves
When the metric decreases, it indicates that a token‘s value is low and there is a possibility of a price increase. According to experts, several other measures also show a bullish trend. Furthermore, according to CryptoQuant’s analyses, Bitcoin‘s exchange reserve is decreasing. This could mean that there is high buying pressure on the cryptocurrency. Additionally, the sentiment in the derivatives market was predominantly bullish, which can be seen from the buy/sell ratio.
Although these measures indicate a bullish trend, some analysts have suggested the opposite, stating that BTC’s price could reach the support level in the coming days. Moreover, cryptocurrency experts note that long-term holders (LTH) and short-term holders (STH) may witness a short-term price correction for BTC, which could mean that the movements of long-term holders over the past seven days have been above average.

 Türkçe
 Español


