After an analyst warned about the order book liquidity, Bitcoin followed a volatile path on January 15th. Data from TradingView showed that Bitcoin’s volatility resumed after a journey close to the $43,000 level. The price movements occurred on a day when Wall Street was closed, leaving room for more irregular price movements.
What’s Happening on the Bitcoin Front?
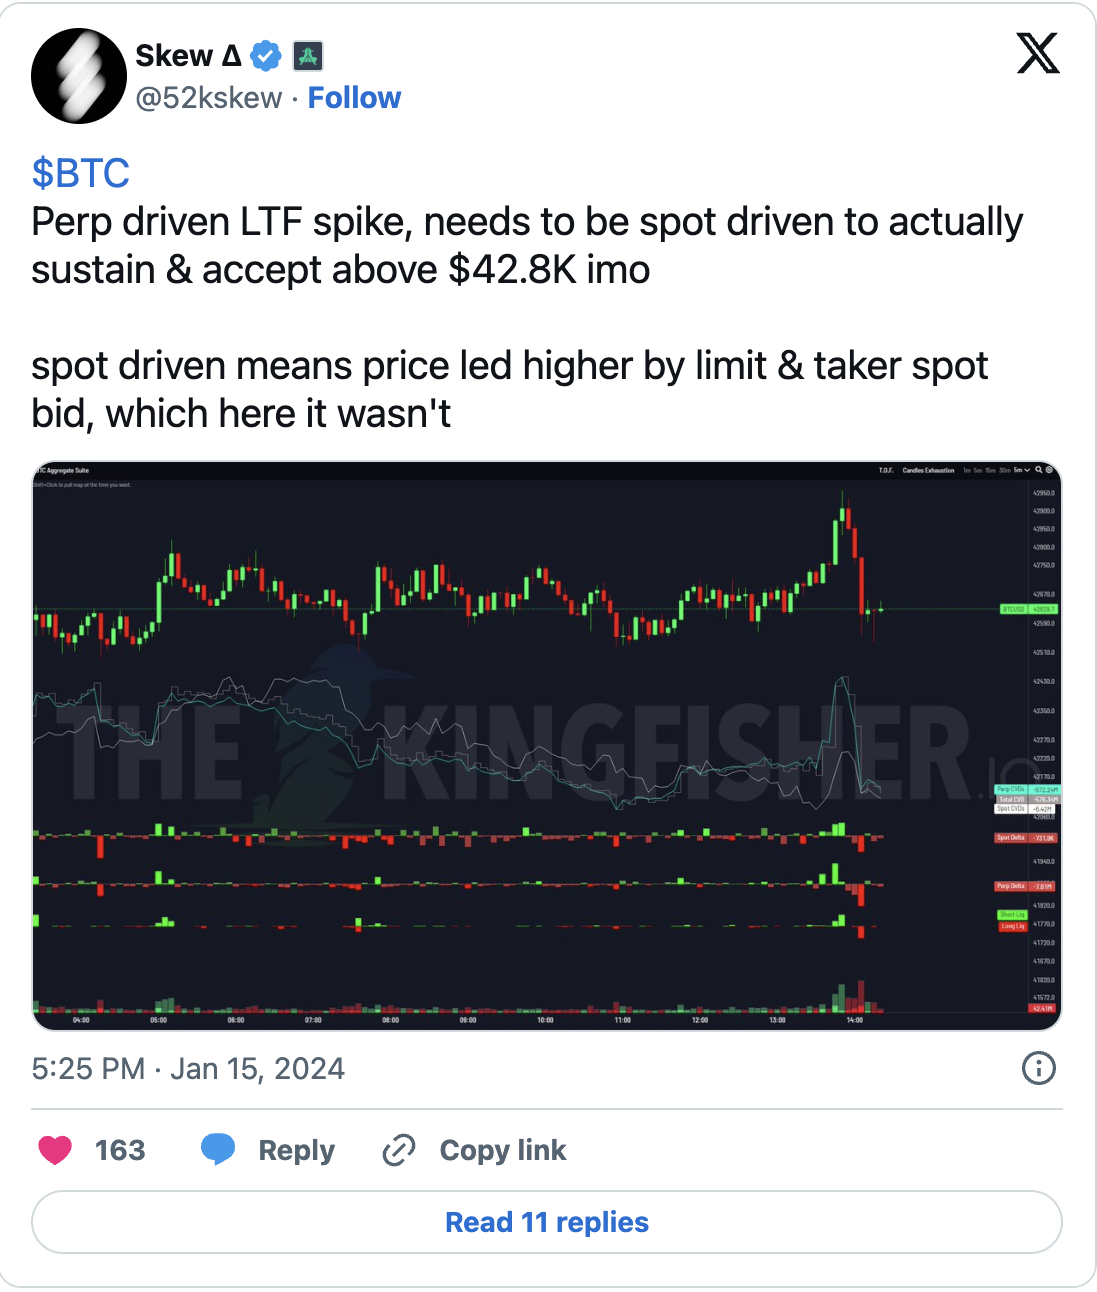
Popular investor Skew shared with his followers that spot markets generally lack sufficient depth to maintain stability in low time frames, and he stated:
“There is currently very limited liquidity, so we expect some kind of $1,000 candle to emerge out of nowhere later.”
Skew also added that the price movements in the $43,000 region were driven by the futures market and therefore likely unsustainable.

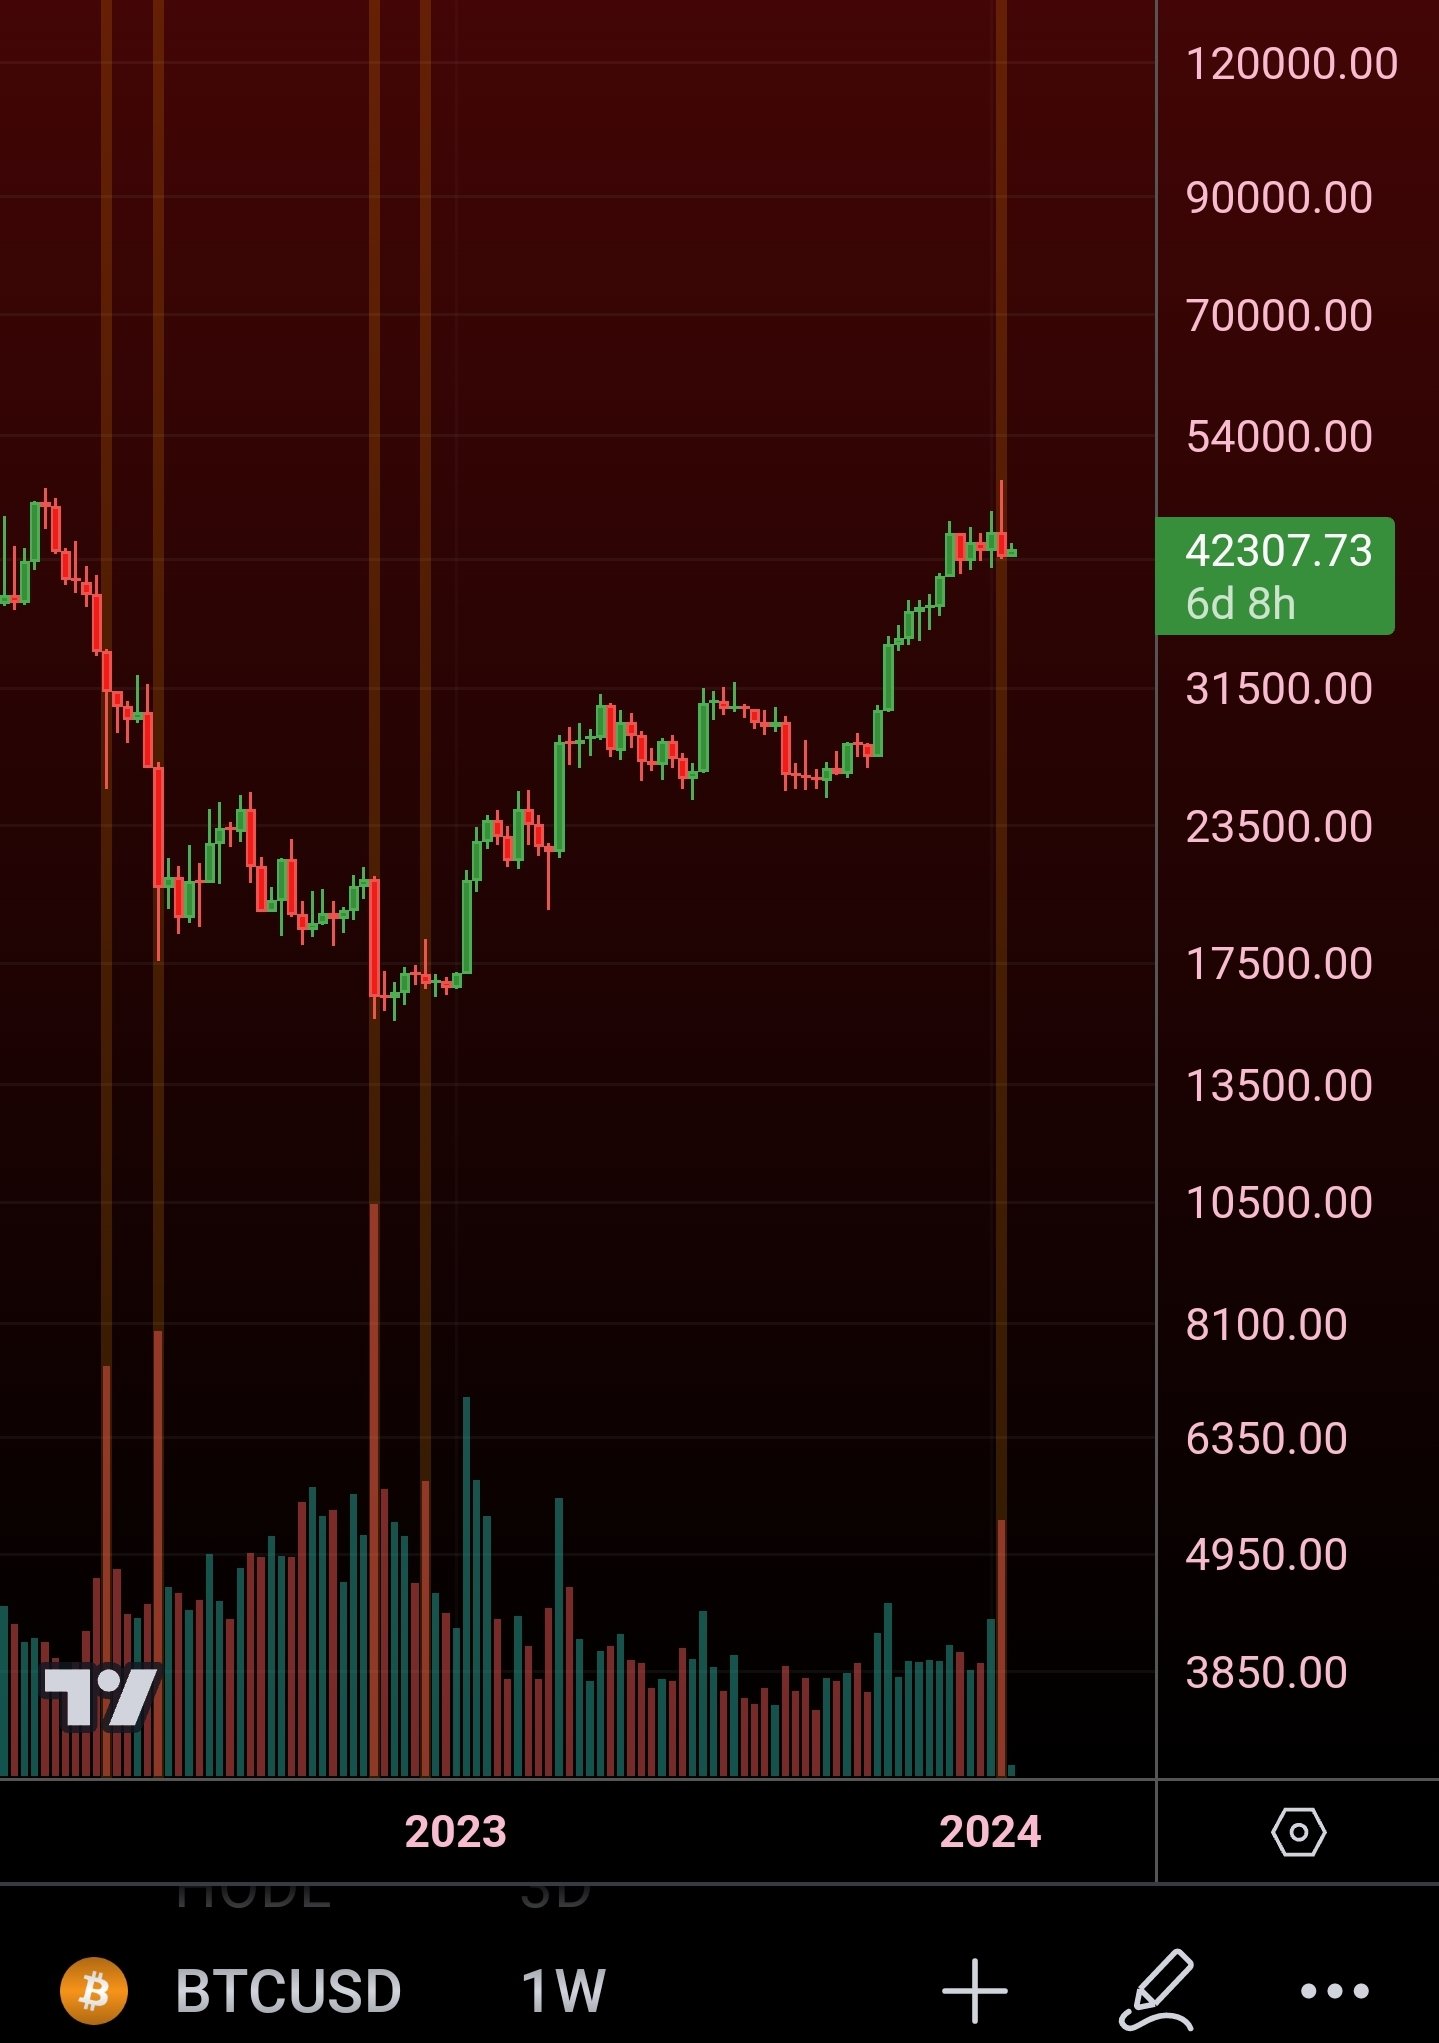
Meanwhile, analyst Matthew Hyland, who made predictions about when the levels lost after last week’s 15% drop in the BTC/USD pair would be regained, thinks the recovery could potentially take more than a month. Hyland commented on the subject with a chart showing buying and selling volumes:
“Bitcoin may continue to move sideways for a while. In the last 4 times we saw this much red volume on a weekly basis; there was at least 3-4 weeks of horizontal price movement. If the pressure breaks, this environment will be beneficial for Ethereum and the altcoin market.”

The chart made comparisons between the panic selling that occurred last week and the atmosphere at the end of the 2022 bear market for Bitcoin.
Famous Analyst Shares Halving Chart
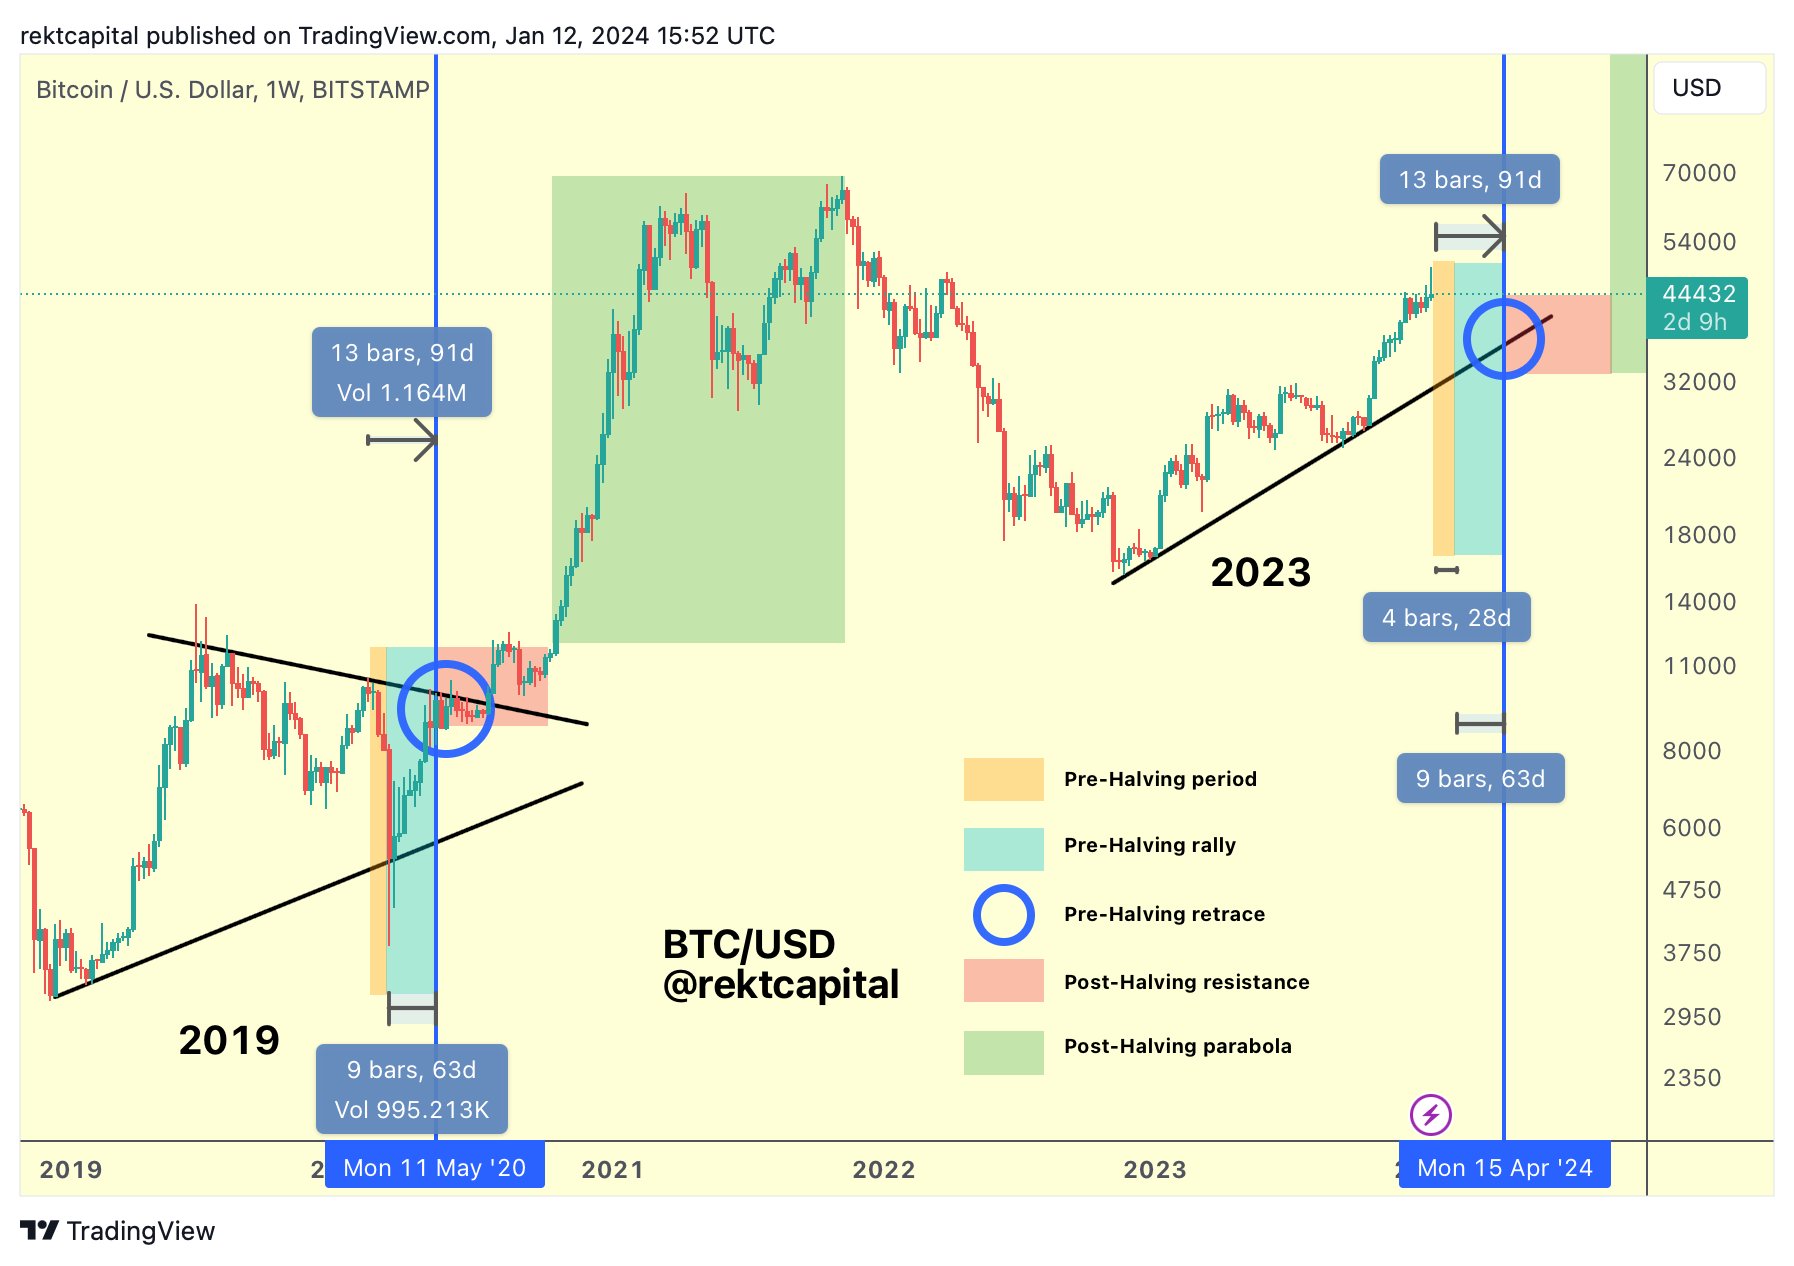
Amid these developments, popular investor and analyst Rekt Capital shared a possible roadmap for Bitcoin’s price movement before the halving event in April. According to Rekt Capital, last-minute gains will show themselves about two months before the event, leaving bears very little time to cause a significant drop:
“If Bitcoin is to have a deeper pullback before the halving event (orange), it should happen within the next 30 days.”

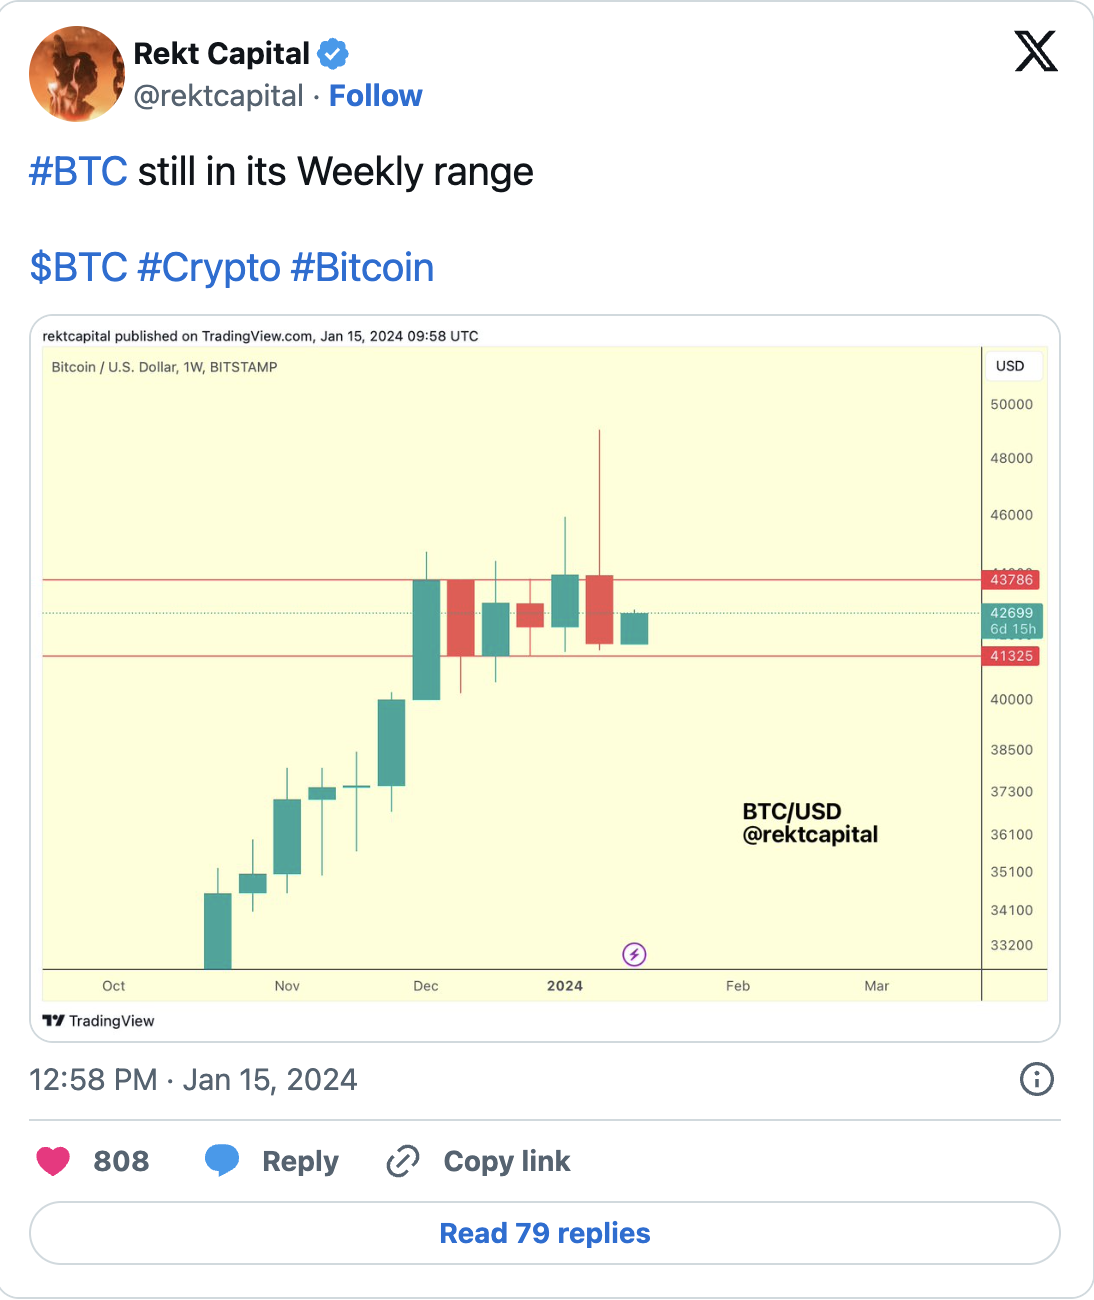
Following this post, in a subsequent post, the famous figure evaluated the BTC/USD pair on a weekly chart despite the recent volatility.


 Türkçe
 Español


