Dogecoin price followed an upward trend in 2024, reaching a notable formation’s resistance trend line in chart analysis. This movement was also observed by analysts as Dogecoin’s second attempt to surge. Will Dogecoin succeed at this point? We examine this with detailed chart analysis, significant support and resistance levels, and expert opinions.
Weekly DOGE Chart Analysis
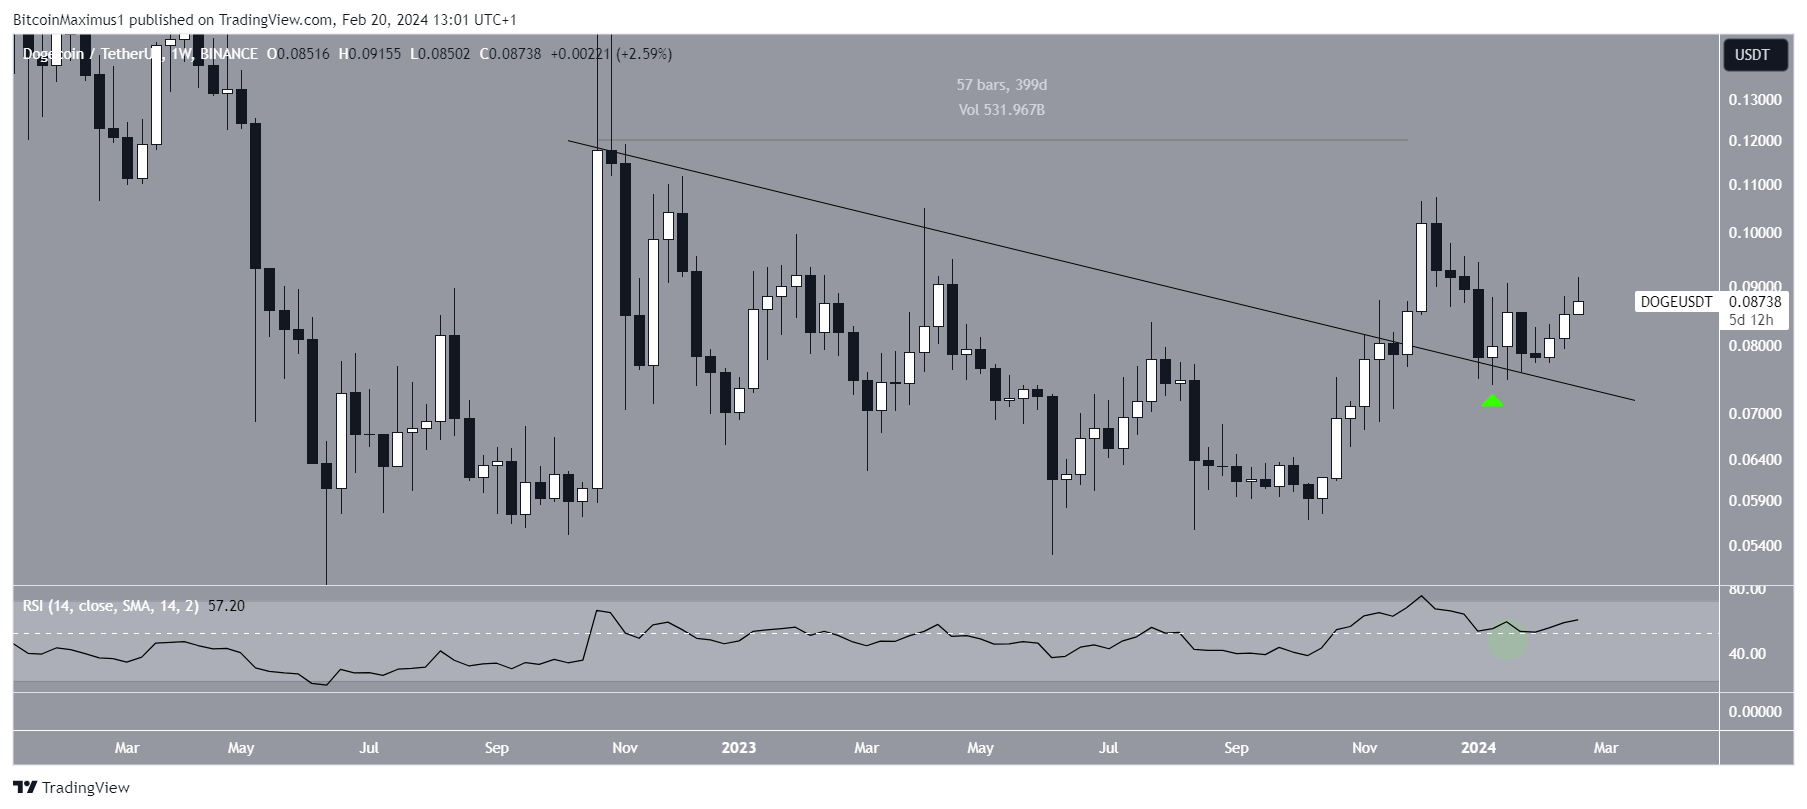
The weekly chart’s technical analysis shows that the DOGE price broke out from a decreasing resistance trend line in November 2023. The trend line had been in focus for 400 days before the breakout. DOGE reached a high level of $0.107 before the decline. However, the DOGE price jumped at the resistance trend line in January 2024 and showed an increase despite being below the highest level of 2023. The weekly Relative Strength Index (RSI) supports the continuation of this rise.
RSI is a momentum indicator that investors follow with interest, as it helps them assess whether a market is overbought or oversold and whether an asset will be accumulated or sold.
RSI readings above 50 and an upward trend indicate that bulls are still at an advantage, while readings below 50 suggest the opposite. When the price jumped at the resistance trend line, the RSI rose above 50 (green circle), supporting the movement.

Daily DOGE Chart Analysis
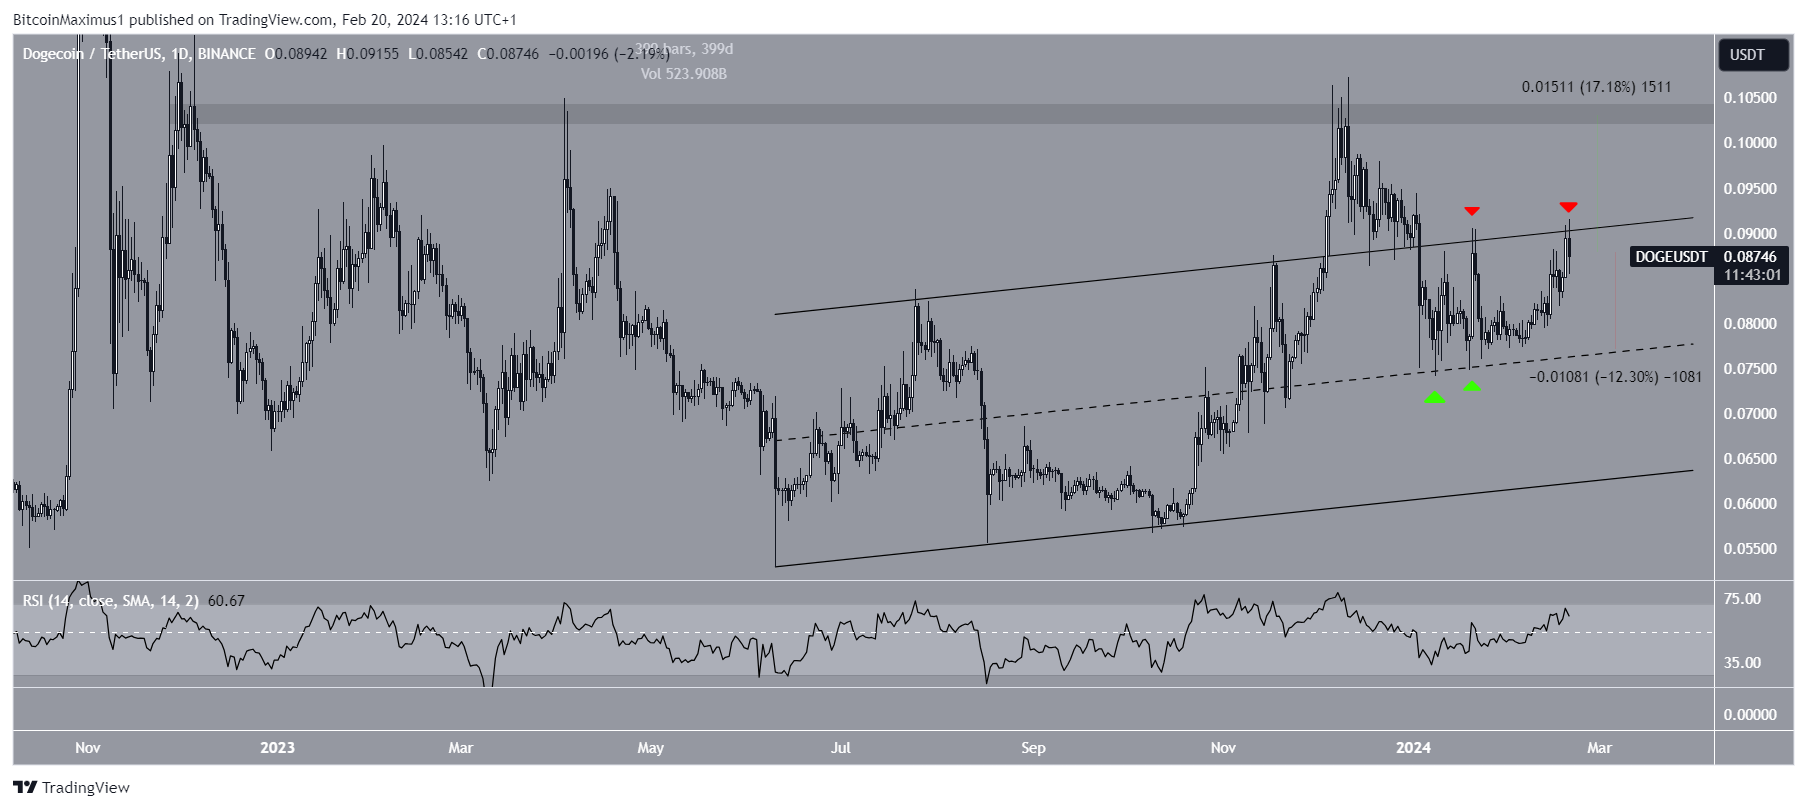
The daily chart shows that DOGE has been trading within a rising parallel channel since June. It initially broke above the channel in November 2023 but fell back into the channel shortly after. Despite the drop, DOGE rose to the channel’s mid-line and is now attempting to break out from the resistance trend line (red symbols). The daily RSI supports the likelihood of a breakout as it is above 50 and rising.
Cryptocurrency investor InmortalCrypto predicts that Dogecoin will soon end its long-term consolidation phase and start a new bull run. If DOGE exits this channel, it could first increase by 17% and reach the next resistance at $0.103.

Despite the rising Dogecoin price prediction, a rejection from the channel’s resistance trend line could lead to a 12% drop to the mid-line at $0.078.

 Türkçe
 Español


