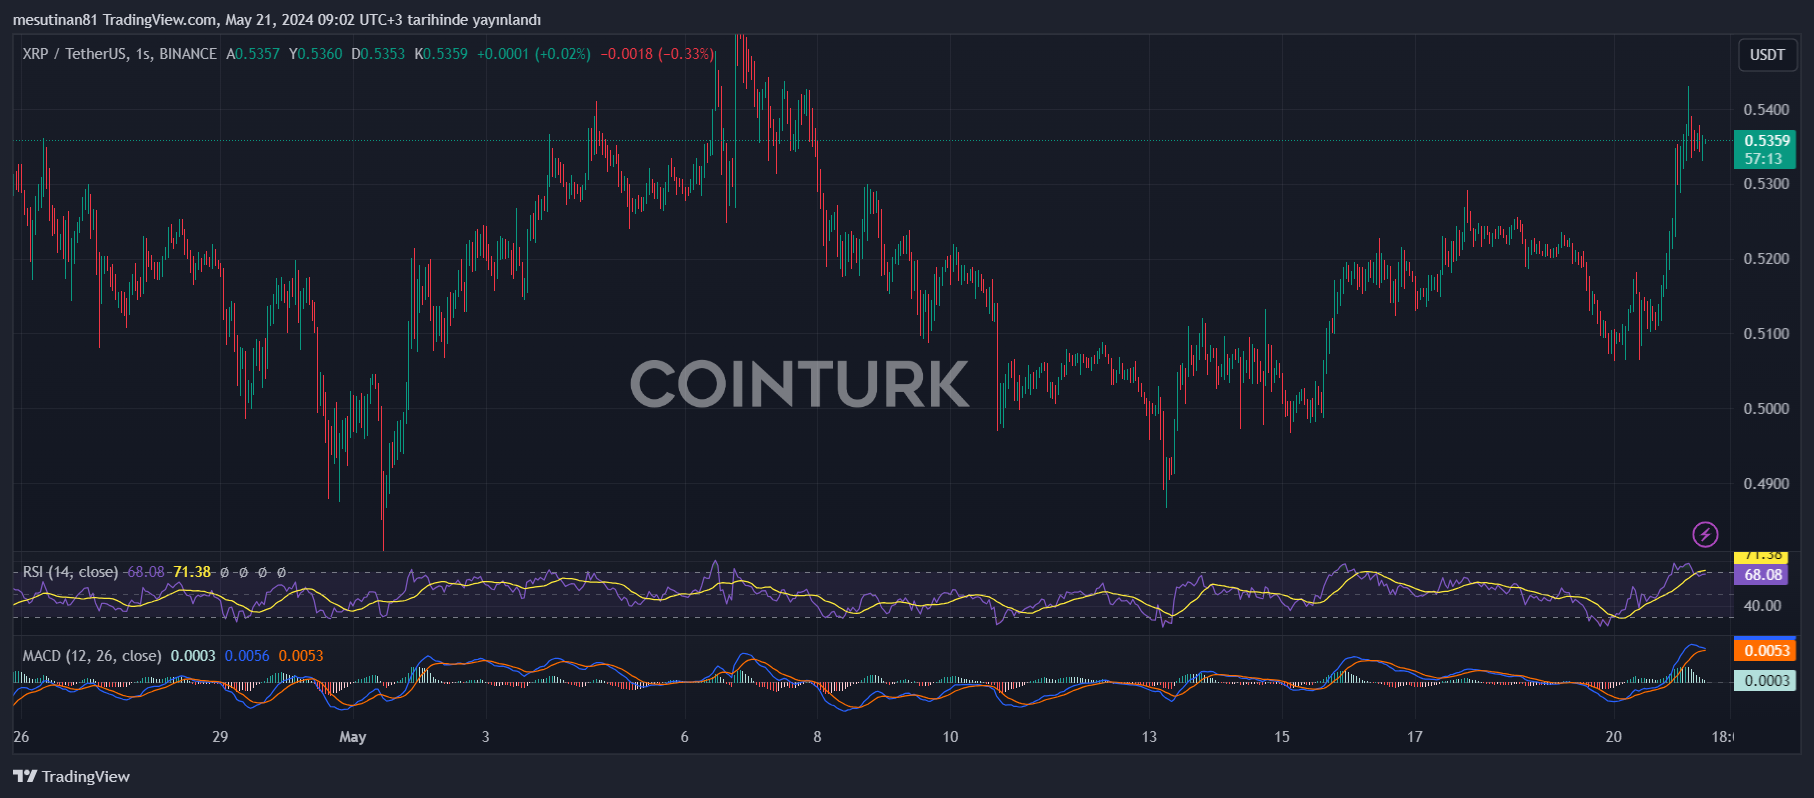
The cryptocurrency market was shaken last night by Ethereum’s impressive rise, while XRP continued its uncertain path. XRP’s participation in the rise led by ETH was limited. At the time of writing, XRP was at $0.53.
XRP Struggles to Overcome Resistance Levels
Looking at XRP’s recent performance, we can see that it started an increase above the $0.5150 resistance level. Currently, the price is trading above the $0.5250 level. Notably, there was a break above a significant downtrend line at $0.520 resistance on the hourly chart of the XRP/USD pair. This indicates that the bulls are gaining momentum and the price has significant upward potential in the near term.
XRP’s recovery wave was triggered by Ethereum’s rise of over 20% and Bitcoin surpassing the $70,000 level. However, we see that the price is currently correcting its gains. The immediate resistance level for XRP is shown as $0.5380. However, the first key resistance is around $0.5420. A close above this level could push the price higher and open the way towards the next key resistance level around $0.5550.
Investors should note that if XRP surpasses the $0.5550 resistance level, a new move towards the $0.5650 resistance could be possible. Further gains could push the price to the $0.5720 resistance, thus determining XRP’s performance in the coming days.
XRP Price Analysis: $0.5380 Resistance Zone Plays a Critical Role
The current state of XRP highlights the importance of the $0.5380 resistance zone as a critical determinant for future movements. As of now, if XRP fails to surpass the $0.5380 resistance zone, it could initiate a downward correction. In this case, the initial support on the downside will be near the $0.5310 level. However, if a more significant decline occurs, the next major support is at the $0.5250 level.

A break below the $0.5220 level and a close below this level could accelerate the price towards lower levels. In this scenario, XRP’s price might drop and test the $0.5065 support in the near term.
Technical Indicators Show Slowing Momentum
Looking at the technical indicators, the hourly MACD for XRP/USD is losing momentum in the bullish zone. However, the hourly RSI (Relative Strength Index) is above the 50 level for XRP/USD. This level can be interpreted as a potential bullish signal for the price.
The main support levels are $0.5310 and $0.5220, while the main resistance levels are $0.5380 and $0.5420.

 Türkçe
 Español


