The leading cryptocurrency turned its direction downward again on March 20 due to significant GBTC sales. Cryptocurrencies have been performing negatively for nearly 40 days, impacted by war, sticky inflation, and recent US data alongside new fronts opened by the SEC in crypto. What will happen in May? Let’s take a look at the DXY, SPX, and BTC outlooks.
SP500 Chart Analysis
To understand the Bitcoin price path, it can be useful to examine assets that share positive and negative correlations. The analysis of SP500 and DXY is important both for this reason and to understand the current state of the US economy. Generally, the Bitcoin price moves in tandem with the SP500 during rises and falls.
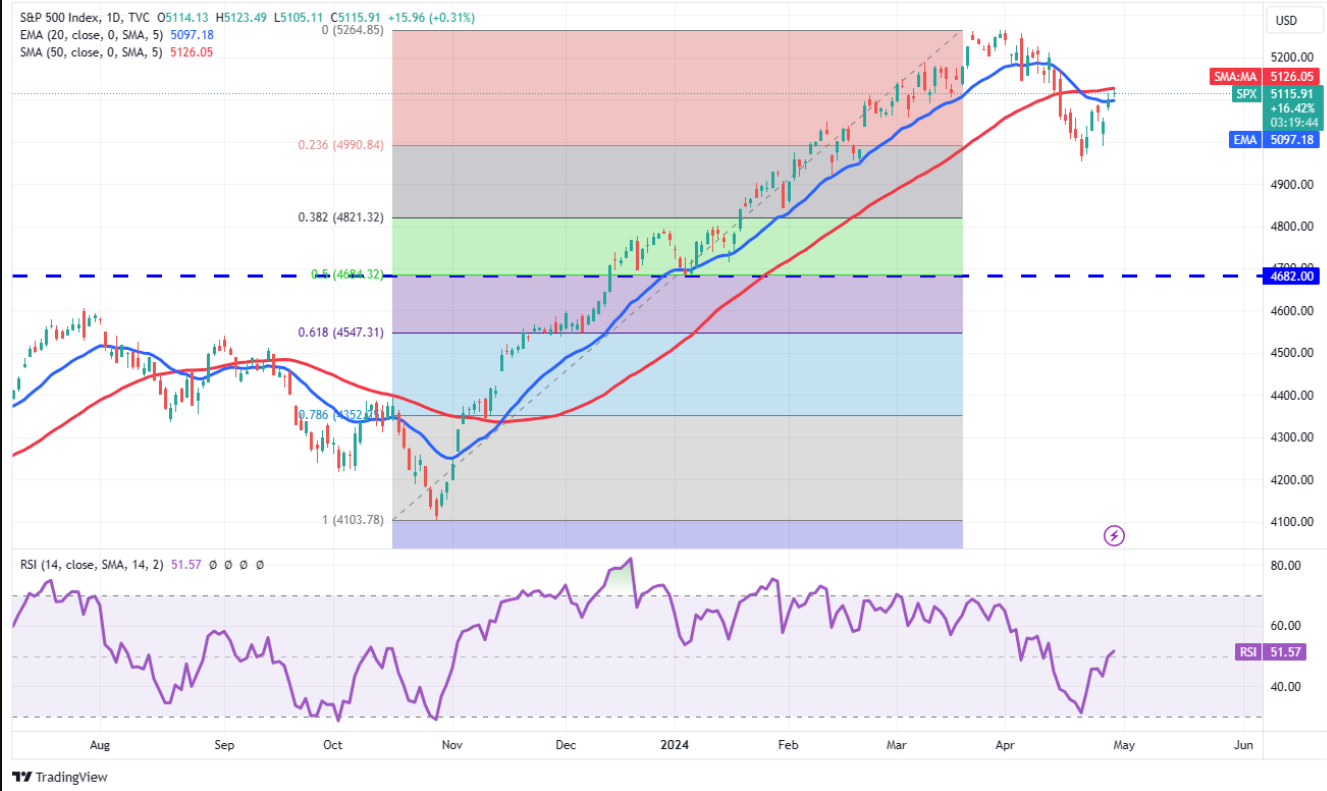
The S&P 500 Index has been trading below moving averages for the past few days, yet bears have not been able to use this advantage for a significant drop. Low-level buying indicates that the Fed’s economic policy may not become more hawkish as feared.

The index has reached an important level to consider, the moving averages. If the price moves above the moving averages, the index could climb to 5,200 and 5,265 levels. Conversely, if it breaks down from here, it could target 4,990 and between 4,953 and 4,821 levels. Volatility is likely to increase following Wednesday’s Fed announcements, potentially driving the index in one of these two directions.
US Dollar Index (DXY) Chart Analysis
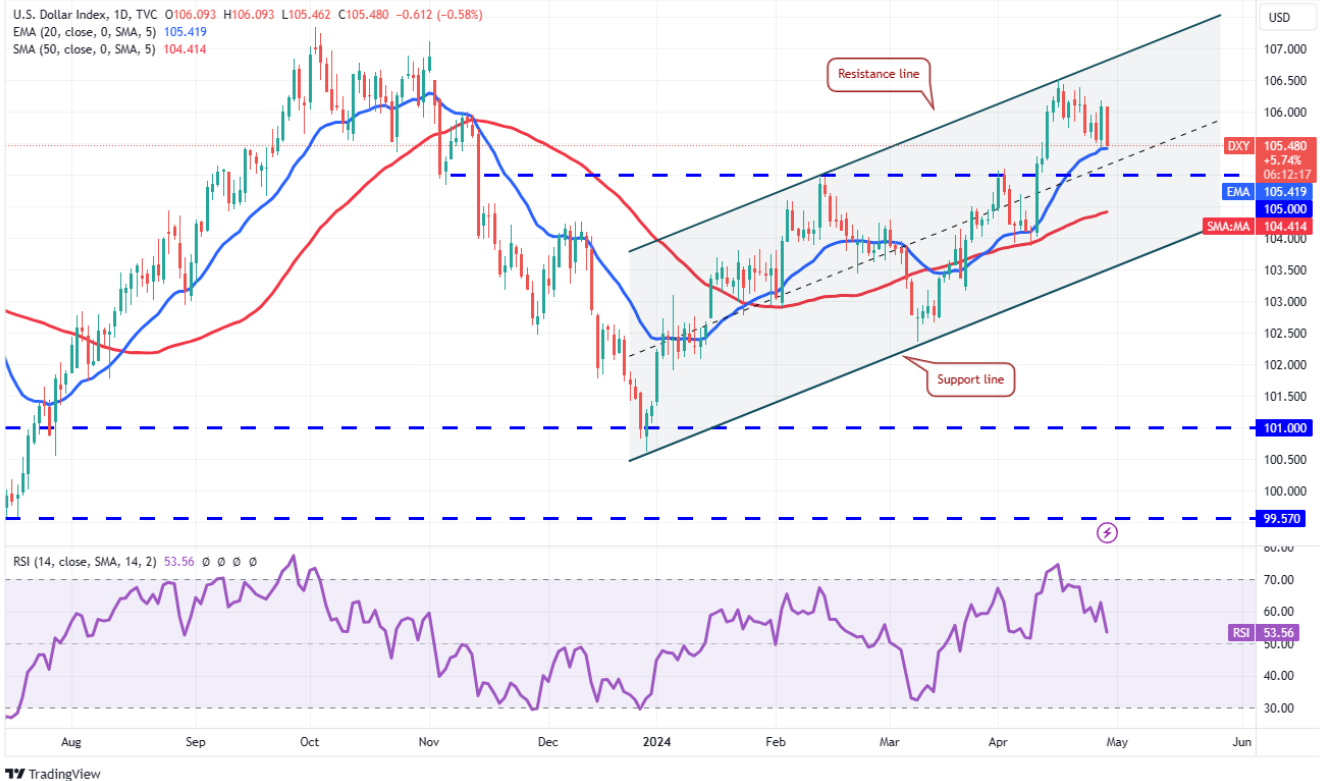
The strengthening of the dollar continues to work against Bitcoin, and the US Dollar Index (DXY) has been in a rising channel formation for the past few days, turning down from the resistance line of the channel on April 17. On April 26, the index rebounded from the 20-day EMA but is not as successful in maintaining high levels as feared.

If the current weakness continues, we could see the index fall to the 104 level, which would be favorable for BTC and altcoins.
Bitcoin (BTC) Chart Analysis
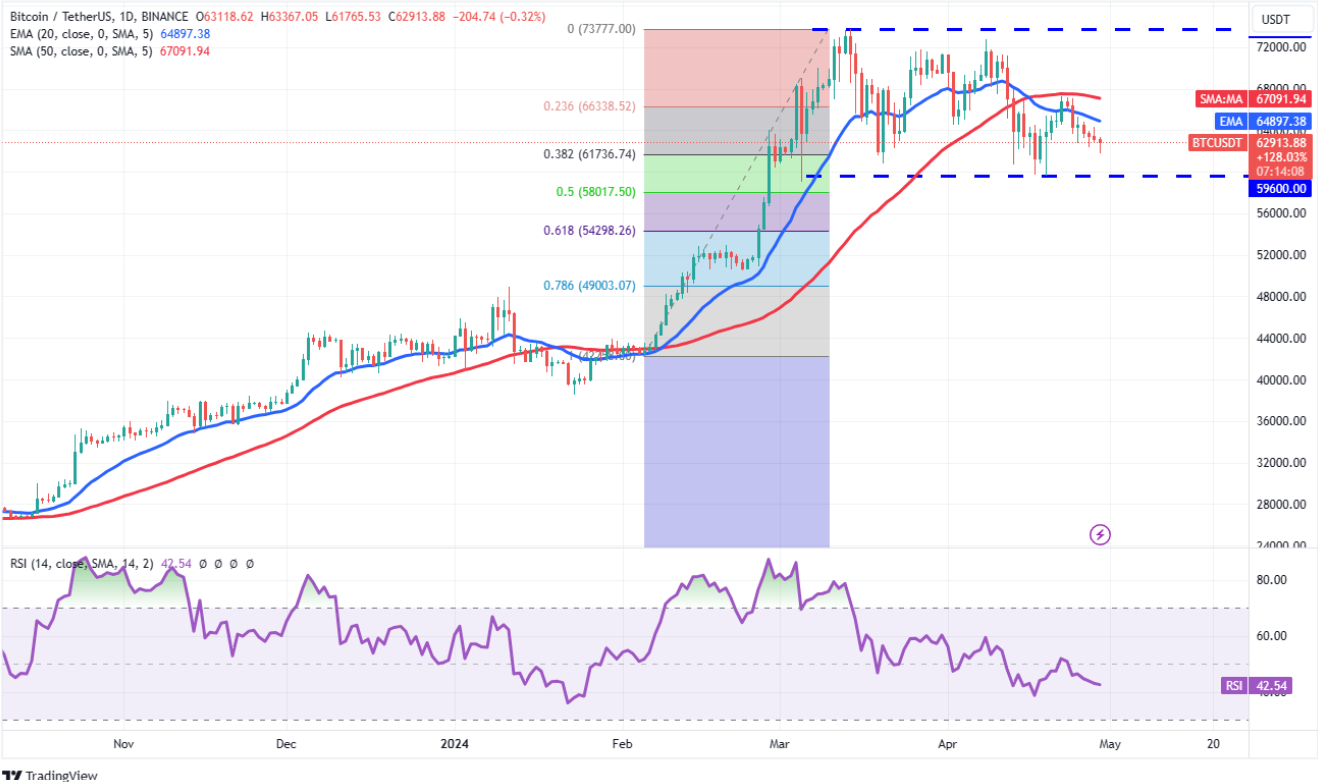
BTC price appears eager to test the strong support level at $59,600. The attitude of the bulls in this support zone will be decisive, and a possible bounce could reach the 50-day SMA at $67,091 for Bitcoin (BTC).

Closures above the resistance-turned region could lead to a test of $73,777, and as short positions worth nearly half a billion dollars are liquidated, this could fuel the rise. In a downturn scenario, $54,298 could be targeted.


