Cryptocurrency analytics firm Glassnode suggested that liquidity has decreased in the altcoin market due to a decrease in risk appetite for risky assets. In a recent analysis, the firm stated that fundamental altcoin metrics are at cyclically low levels, indicating market weakness.
Glassnode Data!
While liquidity remains low in the markets, long-term investors continue to increase their supplies and squeeze liquidity by limiting active trading. This reflects the low liquidity environment in the market, indicating a low risk appetite for the new altcoin framework and highlighting the current liquidity shortage in the cryptocurrency. Glassnode, the leading cryptocurrency analytics company, stated the following in their comments:
As network settlement, exchange interaction, and capital flows remain at cyclically low levels, liquidity continues to dry up in digital assets, underscoring the current acute indifference of the market. While the long-term holder group continues to increase their supplies to new all-time highs (ATHs) while maintaining their stability, the growth of holders tightens the tradable supply, leading to the tightening of active trading. Our new altcoin framework, which simulates the waterfall effect of capital rotation despite the high volatility in altcoin valuation, claims that the risk-taking regime is not in effect, indicating the convergence of the current liquidity shortage for digital assets.

Critical Metric in BTC!
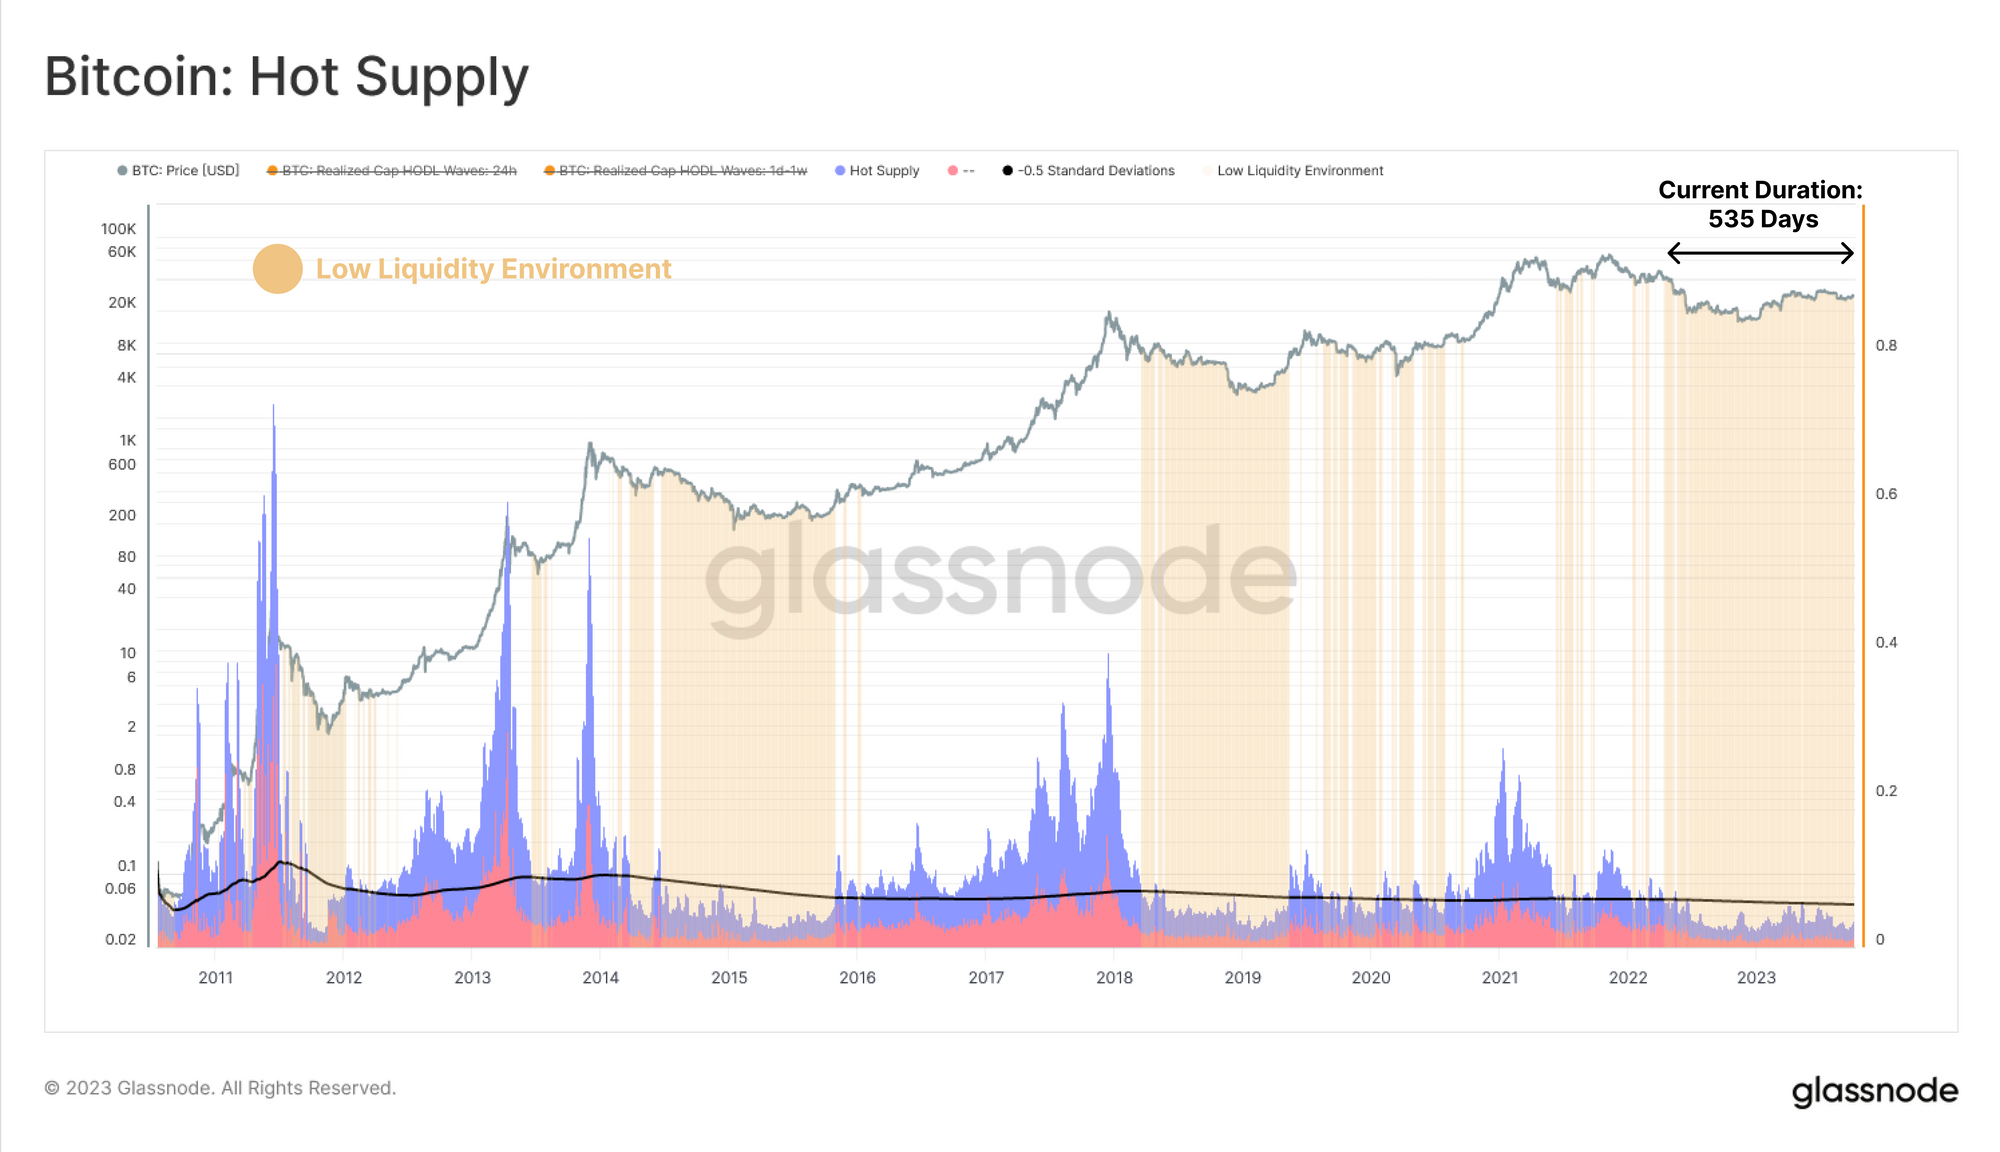
Glassnode also claimed that the “hot supply” metric, which measures the volume of traded cryptocurrencies last week, reached its lowest levels seen in bear markets for BTC liquidity. Glassnode stated the following in their comments:
This stagnation in market liquidity is strikingly evident when evaluating the hot supply metric… We compare the hot supply to the long-term average of Bitcoin supply with a minus 0.5 standard deviation. Based on this, we create a framework that highlights periods of low and contracting market liquidity when the hot supply is below this average -0.5 SD level. These highlighted areas indicate that current liquidity conditions are similar to the bear markets of 2014-15 and 2018-19, which have been in this state for 535 days.

 Türkçe
 Español


