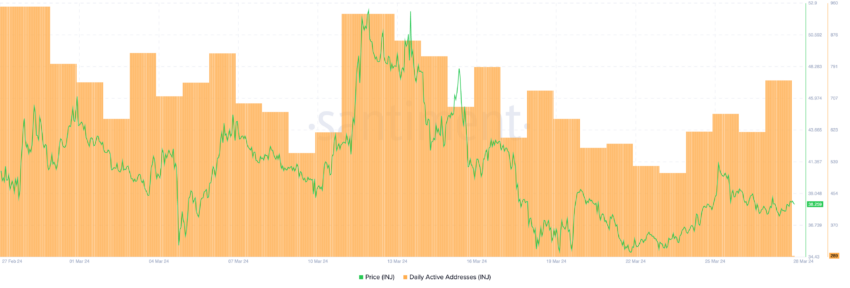
Injective (INJ) price dynamics reveal that 83% of active holders are at their break-even point, which could indicate their anticipation of a price recovery. During the same time frame, INJ’s active addresses have increased following a decline at the end of March.
Current State of INJ Active Addresses
Cryptocurrency unit’s EMA lines suggest a solid consolidation pattern after a 14.62% correction last month. The combination of these factors could indicate a potential uptrend for INJ as the market gains stability and investors remain hopeful. INJ’s price has recently shown signs of recovery, increasing by 5% over the past seven days. This happened after INJ dropped from $51 on March 12th to $35.48 on March 24th. The mentioned recovery could be an important indicator of potential upward momentum as the INJ market tries to emerge from a previous consolidation period that dampened excitement.
Moreover, the role of active addresses is becoming increasingly significant. Currently, 83% of the addresses are at the break-even point. The optimism forming in the cryptocurrency could indicate a strong belief in INJ’s value proposition. This collective sentiment could potentially catalyze additional upward momentum. INJ has recently witnessed an increase in daily active addresses, rising from 509 on March 24th to 755 on March 28th. This increase followed a period of consistent decline in active addresses from mid to late March, where the number dropped from 932 on March 12th to 509.

Daily Address Growth in INJ
Concurrently, INJ’s price also experienced a significant drop, rising from $51 to $35.30. This represents approximately a 30.78% correction. The recent increase in daily active addresses is a positive signal for INJ, suggesting a revival of user engagement and renewed interest in the network. Following a period of activity and price decline, this revival could signal a potential trend reversal, where increased network participation could further boost demand for INJ, support price recovery, and enhance overall market sentiment.
Injective (INJ)‘s 4-hour chart shows converging exponential moving averages (EMA) around the current price, signaling a compressed market. Short-term lines below long-term lines can often indicate a bearish outlook. EMAs are trend-following indicators, giving more weight to recent data while averaging prices over time, which helps determine the direction and strength of the trend.

 Türkçe
 Español


