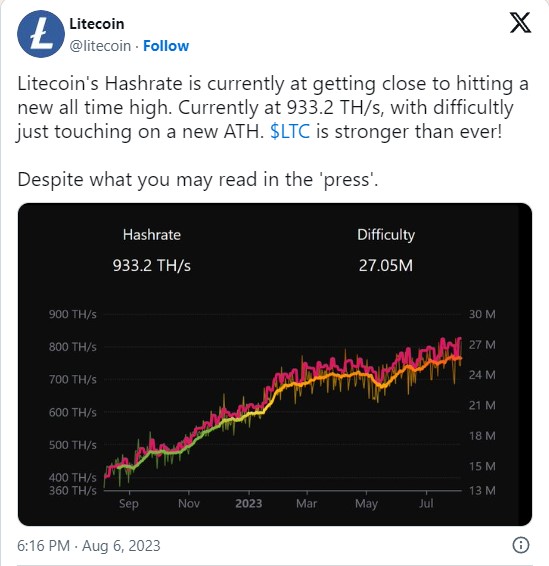
Litecoin (LTC) completed its third halving on August 2, 2023, reducing miners’ rewards by half. The latest tweet shared by the developers of the blockchain revealed that the mining sector has witnessed tremendous growth and is even approaching an all-time high in a significant metric.
However, a closer look at Litecoin’s network statistics reveals a different picture. Furthermore, the halving did not have an immediate positive impact on the price of the cryptocurrency, as the price chart continued to remain in the red.
Is Litecoin Growing After the Halving?
On August 6, Litecoin tweeted highlighting the growth of the mining sector. According to the tweet, the blockchain’s mining difficulty reached an all-time high of 27.05 million, while the hashrate was approaching its ATH.
However, a closer look at the mining measurements revealed that the blockchain’s fundamental statistics were actually declining after the halving event. Coinwarz’s graph revealed that Litecoin’s hashrate started to decline after the surge on August 2. As of press time, Litecoin had a hashrate value of 754.29 TH/s.

Not only that, but another important measure for miners has also been on a downward trend for several weeks. Glassnode’s graph indicated a decrease in Litecoin’s miner fee. The metric started to decline in May 2023 and had a value of 10.5 LTC at the time of writing, which was a negative signal.
In addition to mining measurements, the network activity of the blockchain also followed the same downward trend. According to Bitinfocharts, Litecoin’s transaction count has significantly decreased in the past few months.
Could Litecoin Get Worse?
If the aforementioned measurements are not enough, the performance of the cryptocurrency on the price front has given more reasons for concern. According to CoinMarketCap, LTC has experienced a decline of over 11% in the past seven days. At the time of writing, it was trading at $81.74 with a market capitalization of over $6 billion.
The downward price trend could lead to further decline in the blockchain’s hashrate. With the rewards for LTC miners already halved and the price of the coins continuing to decline, miners may prefer to exit the blockchain in search of more profitable options.
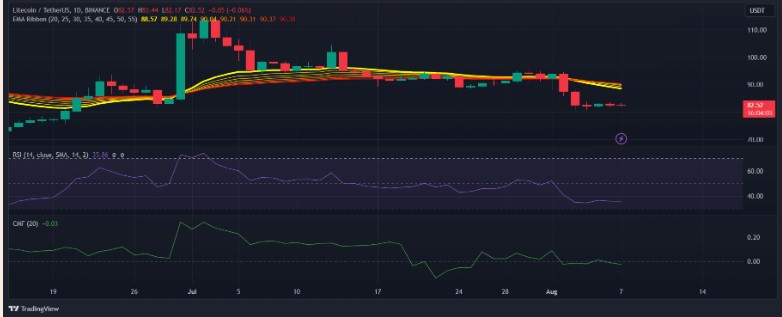
Looking at the daily chart of LTC can help better understand whether its price movement can turn bullish. The Exponential Moving Average (EMA) chart had shown a downward trend. Litecoin’s Chaikin Money Flow (CMF) recorded a decline indicating a bearish trend. Additionally, Litecoin’s Relative Strength Index (RSI) was well below the neutral mark, increasing the chances of a continued downward trend.


