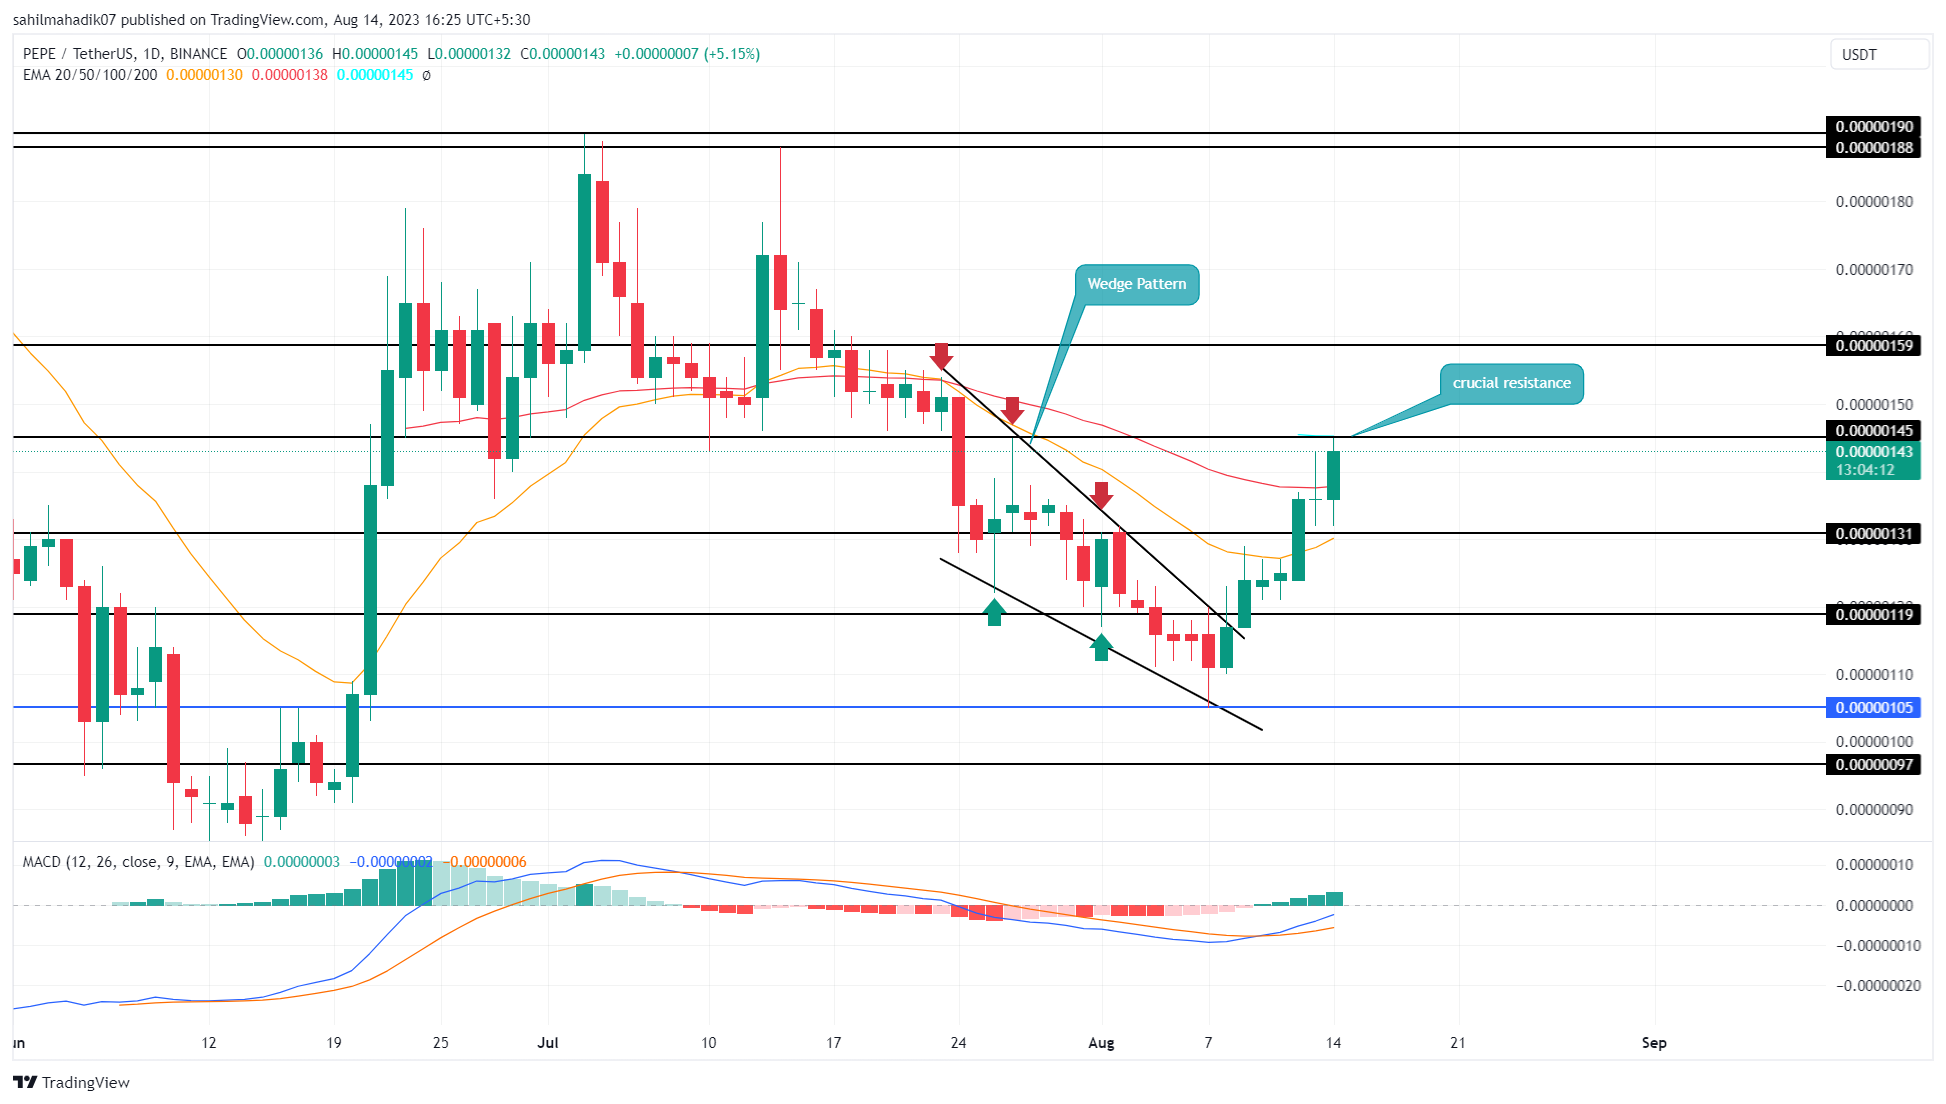
The price of Pepe, which is among the most popular memecoins, started to rise by breaking the resistance trend line of the descending wedge formation on August 8th. The completion of this formation indicates a reversal of the downtrend into an uptrend and triggers a V-shaped recovery in the daily timeframe price chart. In the midst of the seven-day rally, the price of the memecoin recorded a 30% growth, reaching the current level of 0.00000143 dollars, and investors are questioning whether this growth will continue.
Pepe Coin Price Analysis
A V-shaped recovery in the price of an asset indicates aggressive buying and bulls regaining control of the trend. So far, the rally in PEPE’s price has resulted in the breakthrough of two significant horizontal trend resistance lines at 0.00000120 dollars and 0.00000131 dollars.

A 5.15% intraday rise indicates that buyers in the altcoin will make a move to surpass the resistance at 0.0000145 dollars and also the 0.5 Fibonacci retracement level. In the midst of this attack, a small pullback may be expected for the frog-themed memecoin to absorb the accumulated selling pressure.
If the upward momentum is maintained, buyers may bring the price to the 0.5 Fibonacci level. The breakthrough of the resistance corresponding to this level will be the first major signal indicating the continuation of the current uptrend. The price may be expected to continue rising up to 0.0000016 dollars after breaking through this level of resistance.
Can Pepe’s Price Continue the Downtrend?
If the price of Pepe falls below 0.00000131 dollars in the midst of the rally, it will be the most concrete indication that sellers are starting to show strength and exert pressure to continue the downtrend. In such a scenario, a pullback of up to 10% may occur for the retesting of the support at 0.0000012 dollars.
The 100-day Exponential Moving Average (EMA), which corresponds to the level of 0.00000145 dollars, increases the resistance power of this level, but the increasing gap between the signal (orange) of the blue Moving Average Convergence Divergence (MACD) reflects the increasing upward momentum in the market, indicating a high probability of breaking this resistance.

 Türkçe
 Español


