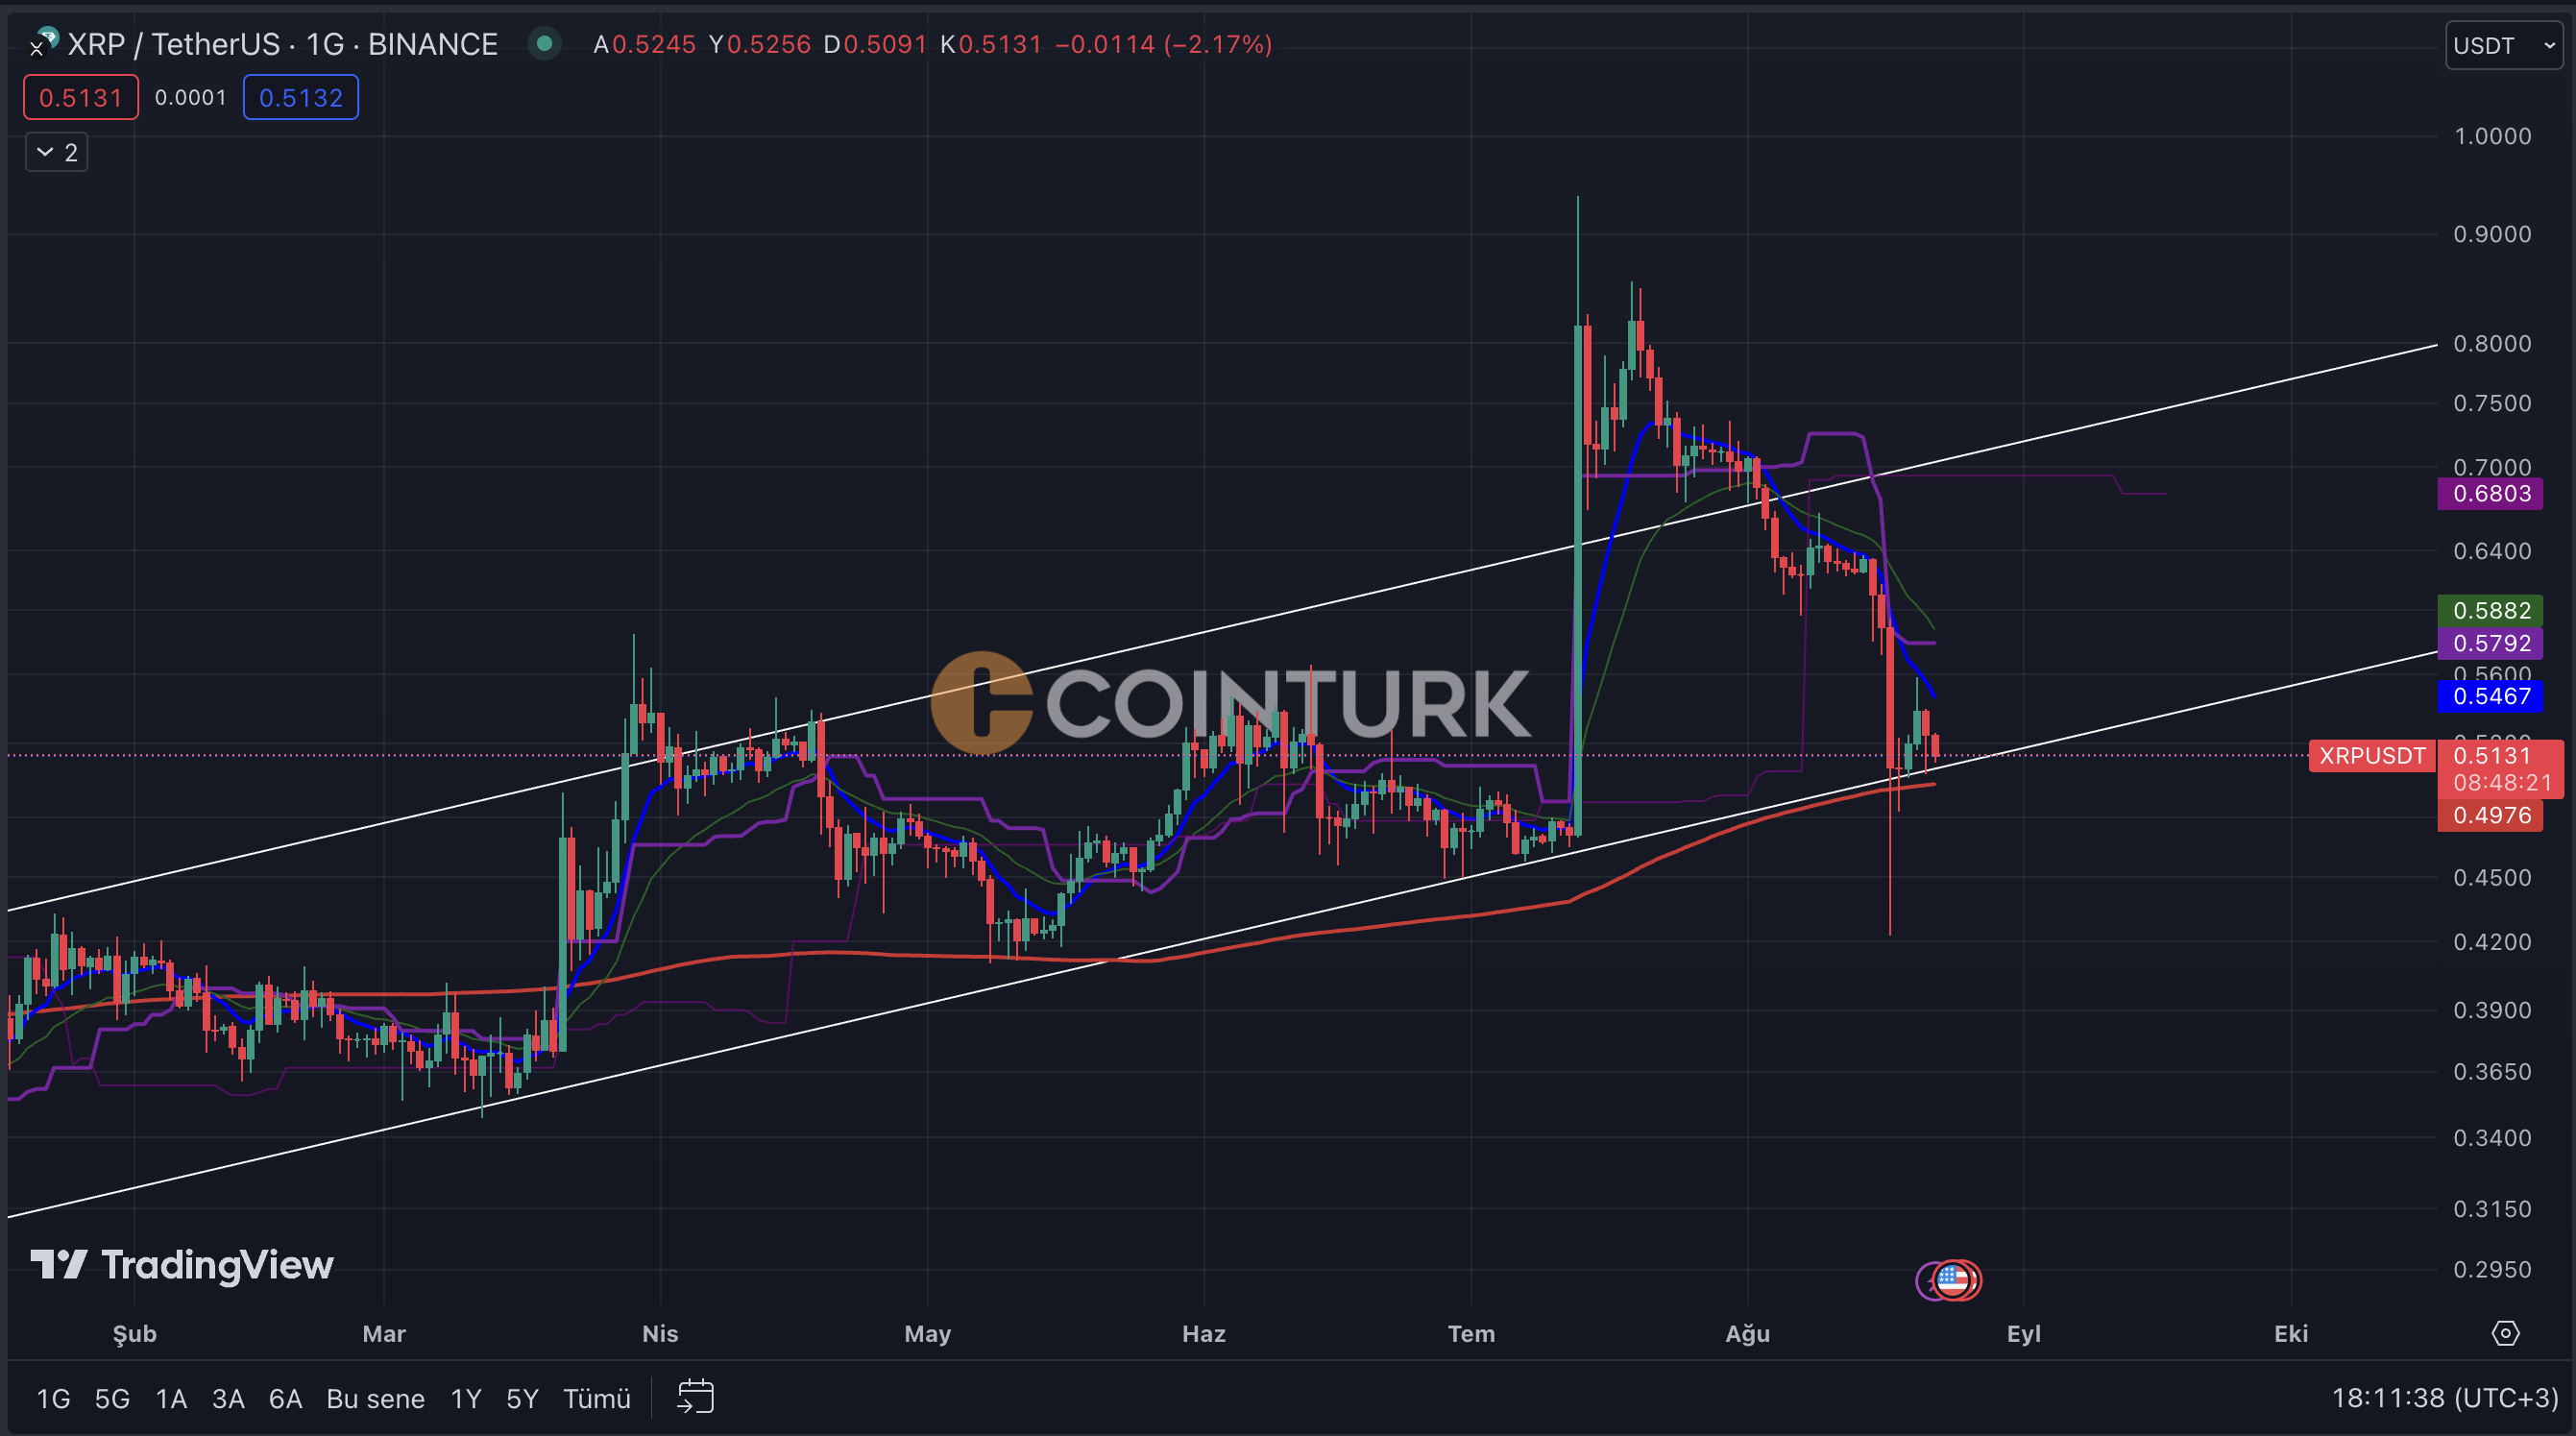
Important data that concerns investors in the daily chart of the most talked about altcoin in recent days, Ripple, can be found. Ripple, which is often in the news with the SEC case, can play an important role in international payment systems in the future with its recent collaborations. After all these developments, we can examine the daily chart.
Ripple Chart Analysis
Unlike many altcoin charts, the rising channel formation previously mentioned continues without any breakouts. Ripple, which survived the negative market conditions after the recent major drop, may experience a new breakout and a mini rally due to the current positive news flow.
The fact that the rising channel formation is not broken and that there is no daily closing below the daily EMA 200 average are the most important factors for the rise of Ripple price. While the market dropped nearly 10% due to the negative news flow in Bitcoin, only a bear trap was seen in Ripple. The ultimate goal of a bear trap is a price drop below the support level set by investors. If the price rises above the support level again within the specified time frame, it indicates that this is a bear trap. Crypto Traders Are Rushing to This App – Here’s Why You Should Too
Important Support and Resistance Levels
Things are progressing positively for Ripple in the technical aspect, as it does not make daily closings below the established supports in the rising channel formation. Especially during a period when futures positions are liquidated and many investors suffer significant losses, the strong technical structure is of great importance for Ripple investors.

The important support levels for Ripple are respectively $0.51, $0.4976, $0.46, and $0.42. Especially the $0.051 level stands out as the support of the channel formation, and for this formation not to be broken, the price should not make a daily closing below this level. The resistance levels for Ripple are respectively $0.579, $0.5882, and $0.68. Especially, if a daily closing is made above $0.68, we can talk about a significant increase.


 Türkçe
 Español


