Technical analysis is an important indicator that investors in the cryptocurrency market, especially those trading in the futures market, need to constantly follow. So, what does technical analysis tell us about Shiba Inu, which is currently trading at $0.00000794? Let’s take a detailed look at the charts, important support and resistance levels.
Shiba Inu Daily Chart Analysis
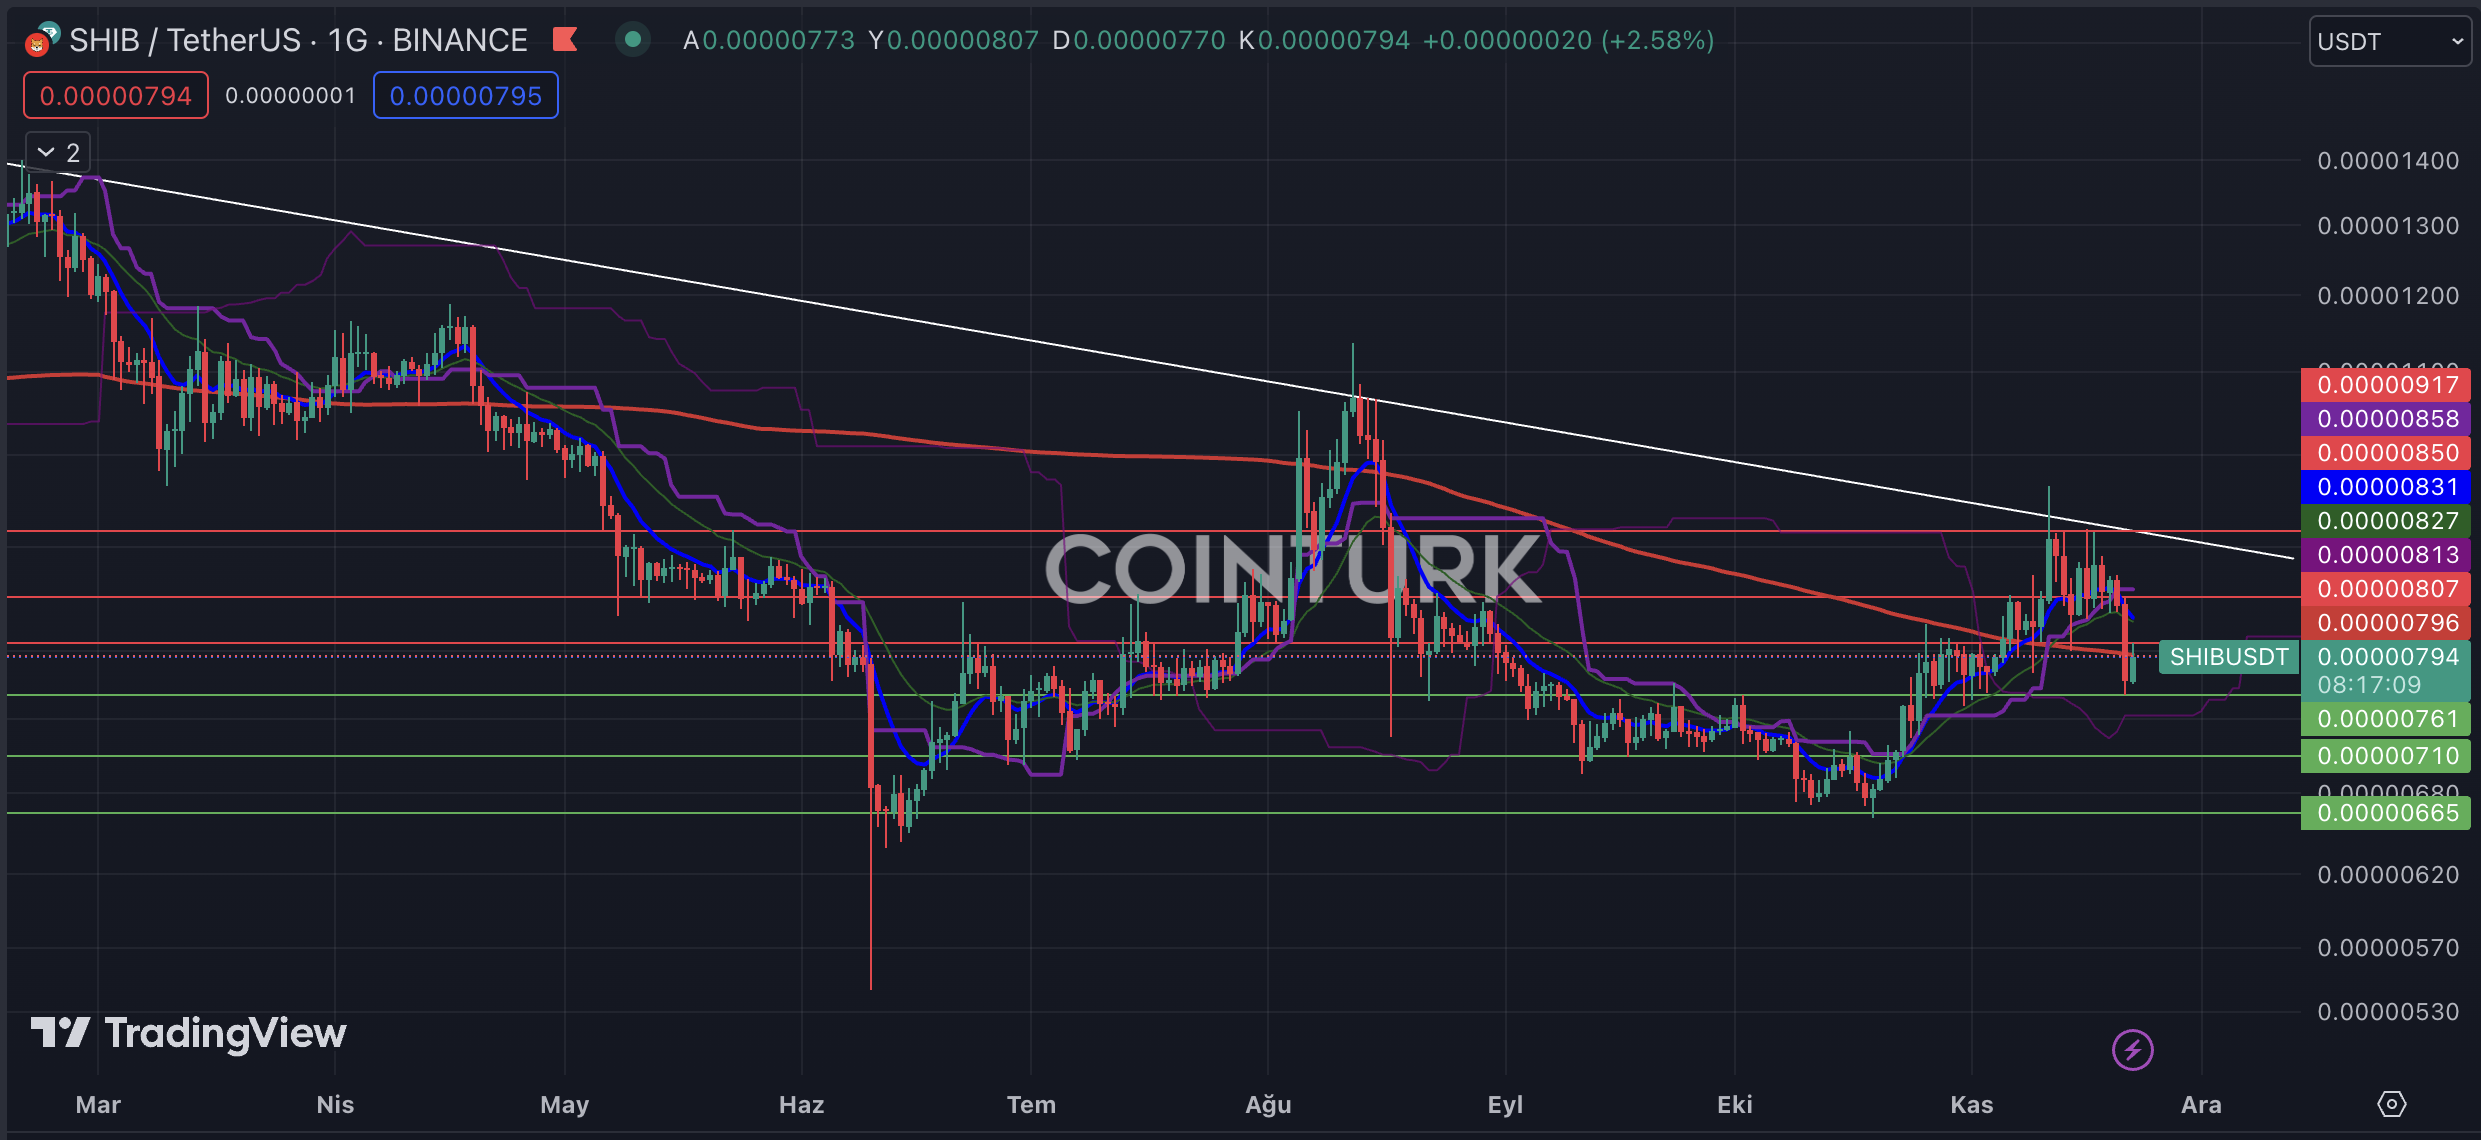
The first notable structure on the daily chart for SHIB is the resistance line. This resistance line, which has been a major obstacle since February 2023, will be crucial for SHIB investors to overcome with a breakout. Short-term breakouts during the rallies in August and November resulted in losses for futures traders.
The most important support levels to watch on the daily chart for SHIB are $0.00000761, $0.00000710, and $0.00000665, respectively. A daily close below the $0.00000761 level, which played a significant role in the drop on November 21, will lead to a significant loss of momentum in SHIB’s price.
The key resistance levels to watch for SHIB on the daily chart are $0.00000807, $0.00000850, and $0.00000917, respectively. A daily close above the $0.00000807 level, intersecting with the EMA 200 (red line), will help SHIB gain momentum in the short term.
Shiba Inu Four-Hour Chart Analysis
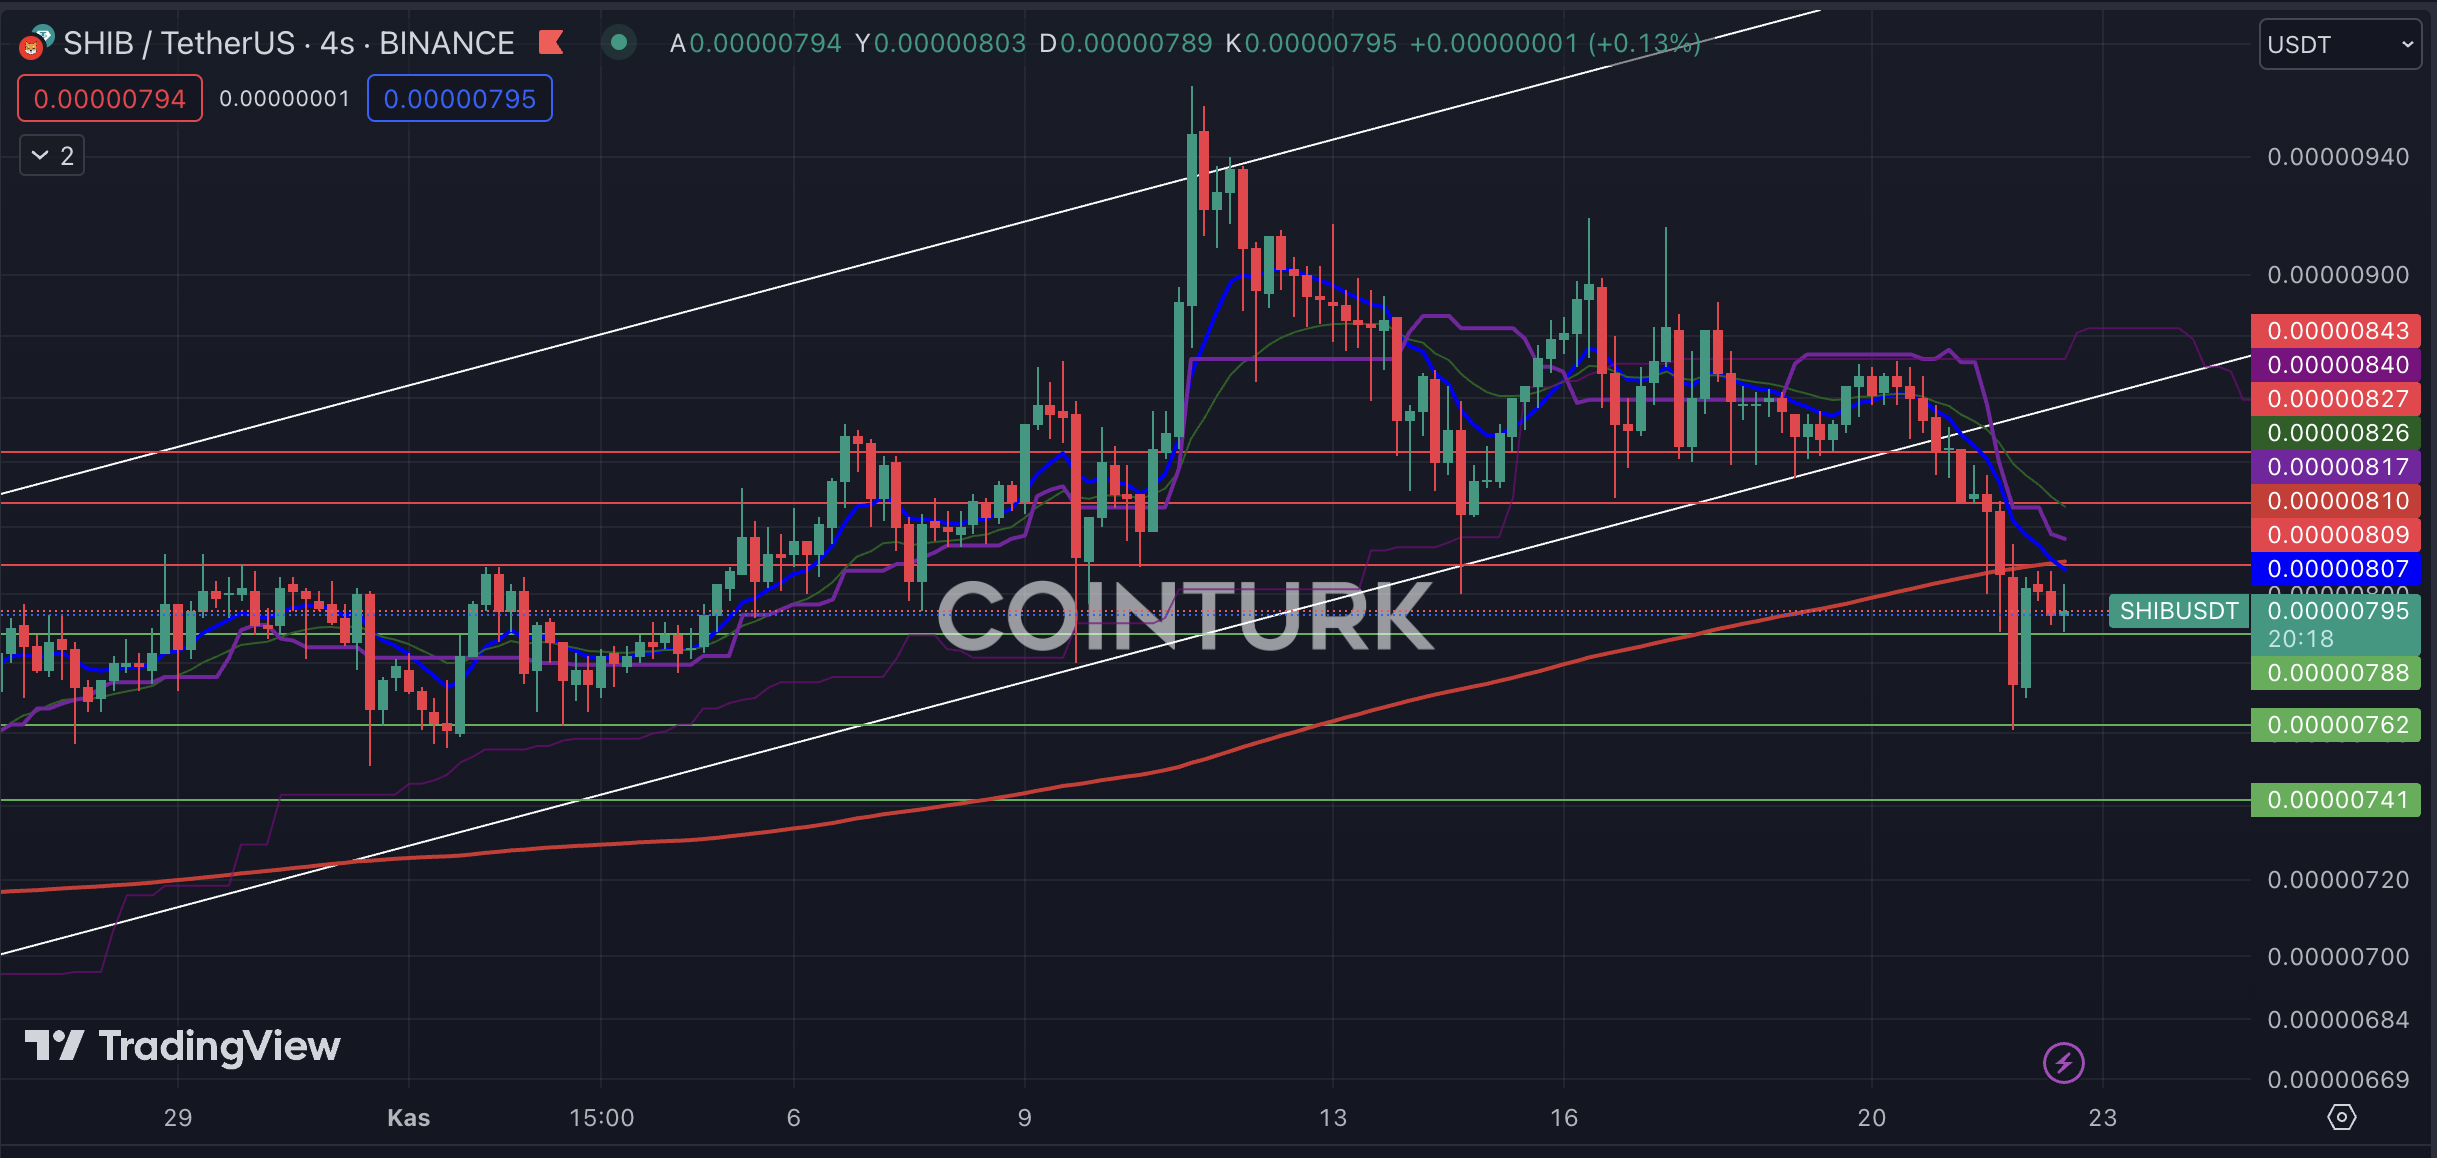
The first notable formation in the four-hour chart analysis of SHIB is the ascending channel pattern. However, with the recent declines, SHIB broke below the support line, resulting in a significant loss of momentum. The resistance of the EMA 200 level (red line) in recent attempts to rise is not a positive scenario for SHIB.
The most important support levels to pay attention to on the four-hour chart for SHIB are $0.00000788, $0.00000762, and $0.00000741, respectively. A bar close below the crucial support level of $0.00000762, which played an important role in the recent drop, will lead to a significant loss of momentum in SHIB’s price.
The key resistance levels to watch for SHIB on the four-hour chart are $0.00000810, $0.00000827, and $0.00000843, respectively. A bar close above the $0.00000810 level, intersecting with the EMA 200 level, will help SHIB gain momentum in the short term.
