The popular altcoin Shiba Inu (SHIB) has recently recorded a significant increase in trading value. This change in the altcoin indicates a notable recovery after a long period of value loss. At the time of writing, SHIB’s price has risen by 3.12% in the last 24 hours to $0.000009361. The altcoin’s current market value has increased by 3.09% during the same period, reaching a total of $5.53 billion. Moreover, trading activity surrounding SHIB has increased. There has been a rise in trading volume reaching $133 million in the last 24 hours. However, the altcoin’s journey has not been without challenges. After reaching a high of $0.00001125 at the beginning of the month, the price added an extra zero as it turned downward.
High Whale Activity Strengthens Shiba Inu’s Position
SHIB’s price is moving upward with bullish market sentiment. Over the past week, the altcoin’s price fluctuated between $0.000009 and $0.000009502. This volatility underscores the tug-of-war between bulls and bears in the market, each vying for dominance in influencing SHIB’s value.

There has been a significant increase in SHIB’s on-chain activity recently. Data from IntoTheBlock shows a striking increase of 1173.58% in transactions over $100,000 in the last 24 hours. This surge indicates that high-volume SHIB holders or whale-level investors are actively moving SHIB across various platforms. Such significant transfers create a bullish trend in altcoin market behavior and reflect strong investor interest in Shiba Inu’s prospects.
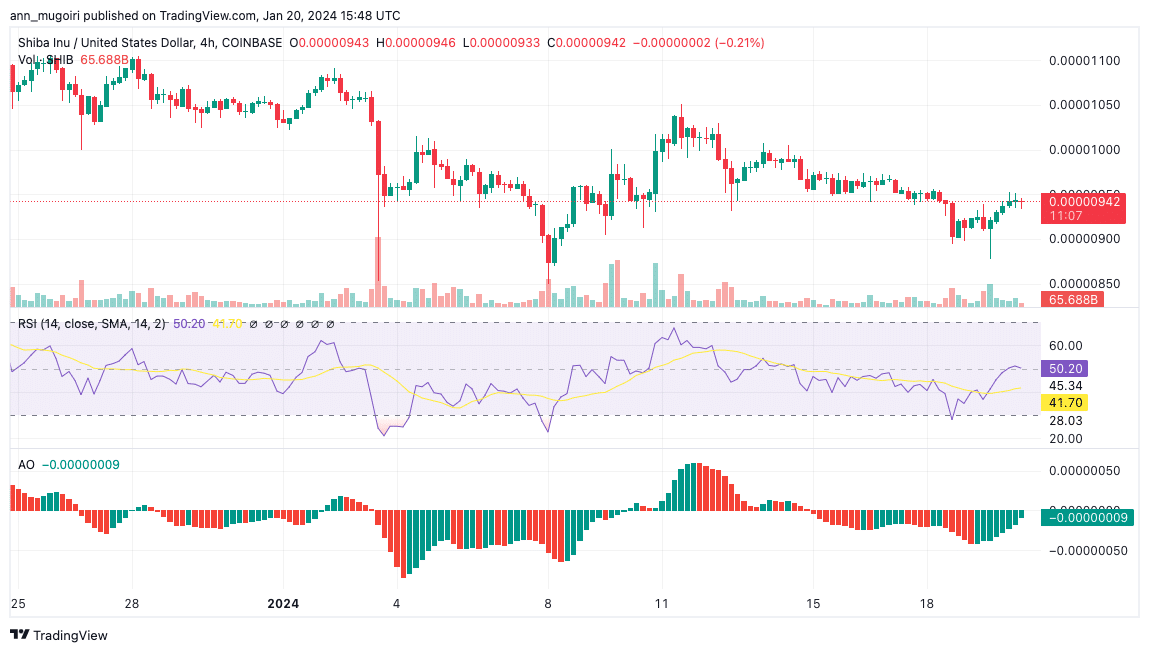
If Shiba Inu manages to break through the first resistance at $0.00001, a potential increase in the altcoin’s price can be expected. Overcoming this barrier and entering the next significant resistance around $0.000015 could pave the way for an upward trajectory towards the $0.00003 level. However, any hesitation at the resistance level of $0.00001 could result in a decline. Support levels are particularly positioned around $0.000009, and dropping below $0.000008 could potentially intensify the downturn, pushing SHIB into a steeper descent.
Technical Indicators Point to a Promising Future for SHIB
Technical indicators in the four-hour timeframe for SHIB support an optimistic outlook. The daily Moving Average Convergence Divergence (MACD) indicator’s line above the signal line indicates a bullish trend due to increased buying activity. Additionally, the positive value of the Awesome Oscillator at 50.20 also reflects a bullish market trend.

The daily Relative Strength Index (RSI) is rising above the 50 level, approaching the overbought limit of 70, signaling an uptrend. Meanwhile, the 50-day Simple Moving Average (SMA) and the 20-day SMA are progressing on an upward trajectory on the chart, reinforcing a short-term bullish sentiment.

 Türkçe
 Español


