The upward momentum in the cryptocurrency market, especially on the Solana side, has enabled investors to make serious gains. The appeal of airdrop events in the Solana ecosystem and the significant momentum gained by many memecoin projects, starting with BONK, has led investors to prefer Solana. So what is expected for Solana in the coming period? We are examining with detailed chart analyses.
Solana Chart Analysis
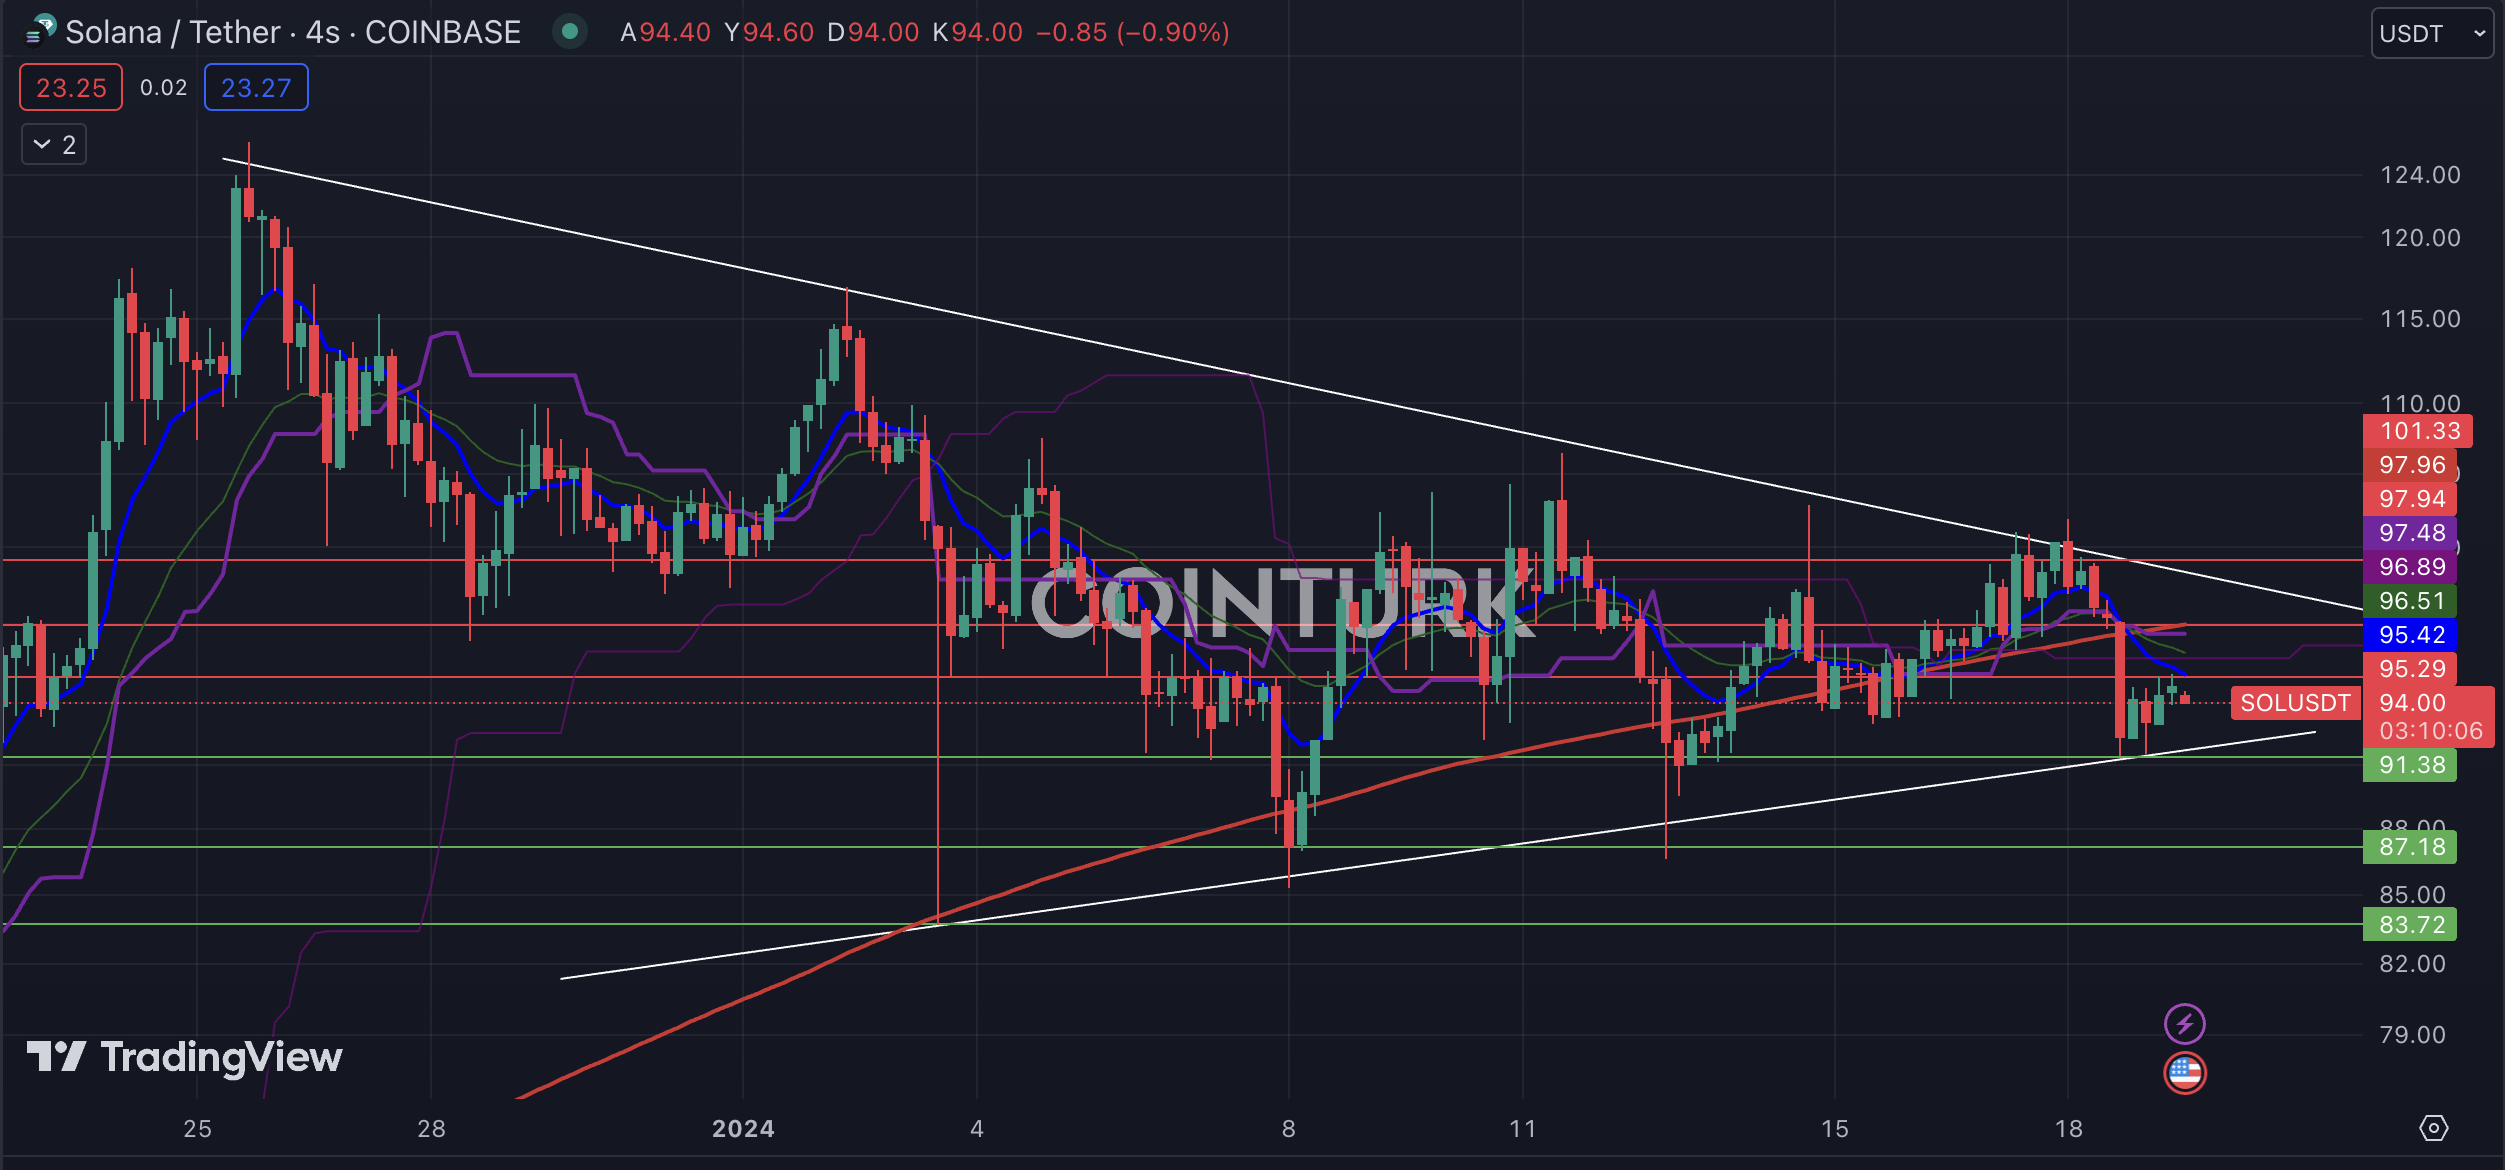
A triangle formation is noticeable in the four-hour Solana chart. In this formation, the breakout of support or resistance will be the most important factor determining the direction. However, the last bar formations staying below the EMA 200 (red line) level bring a negative scenario to the forefront for Solana. Yet, the rise after touching the formation’s support line could facilitate momentum gain for Solana.
The most important support levels to follow on the four-hour Solana chart are, respectively; $91.38, $87.18, and $83.72. Especially, a four-hour bar closing below the $91.38 level, which intersects with the formation support line, could cause the formation to work in a downward direction.
The most important resistance levels to watch on the four-hour Solana chart are, respectively; $95.29, $97.94, and $101.33. Particularly, a four-hour bar closing above the $95.29 level, which intersects with the EMA 200, will facilitate momentum gain for the Solana price.

SOL/ETH Chart Analysis
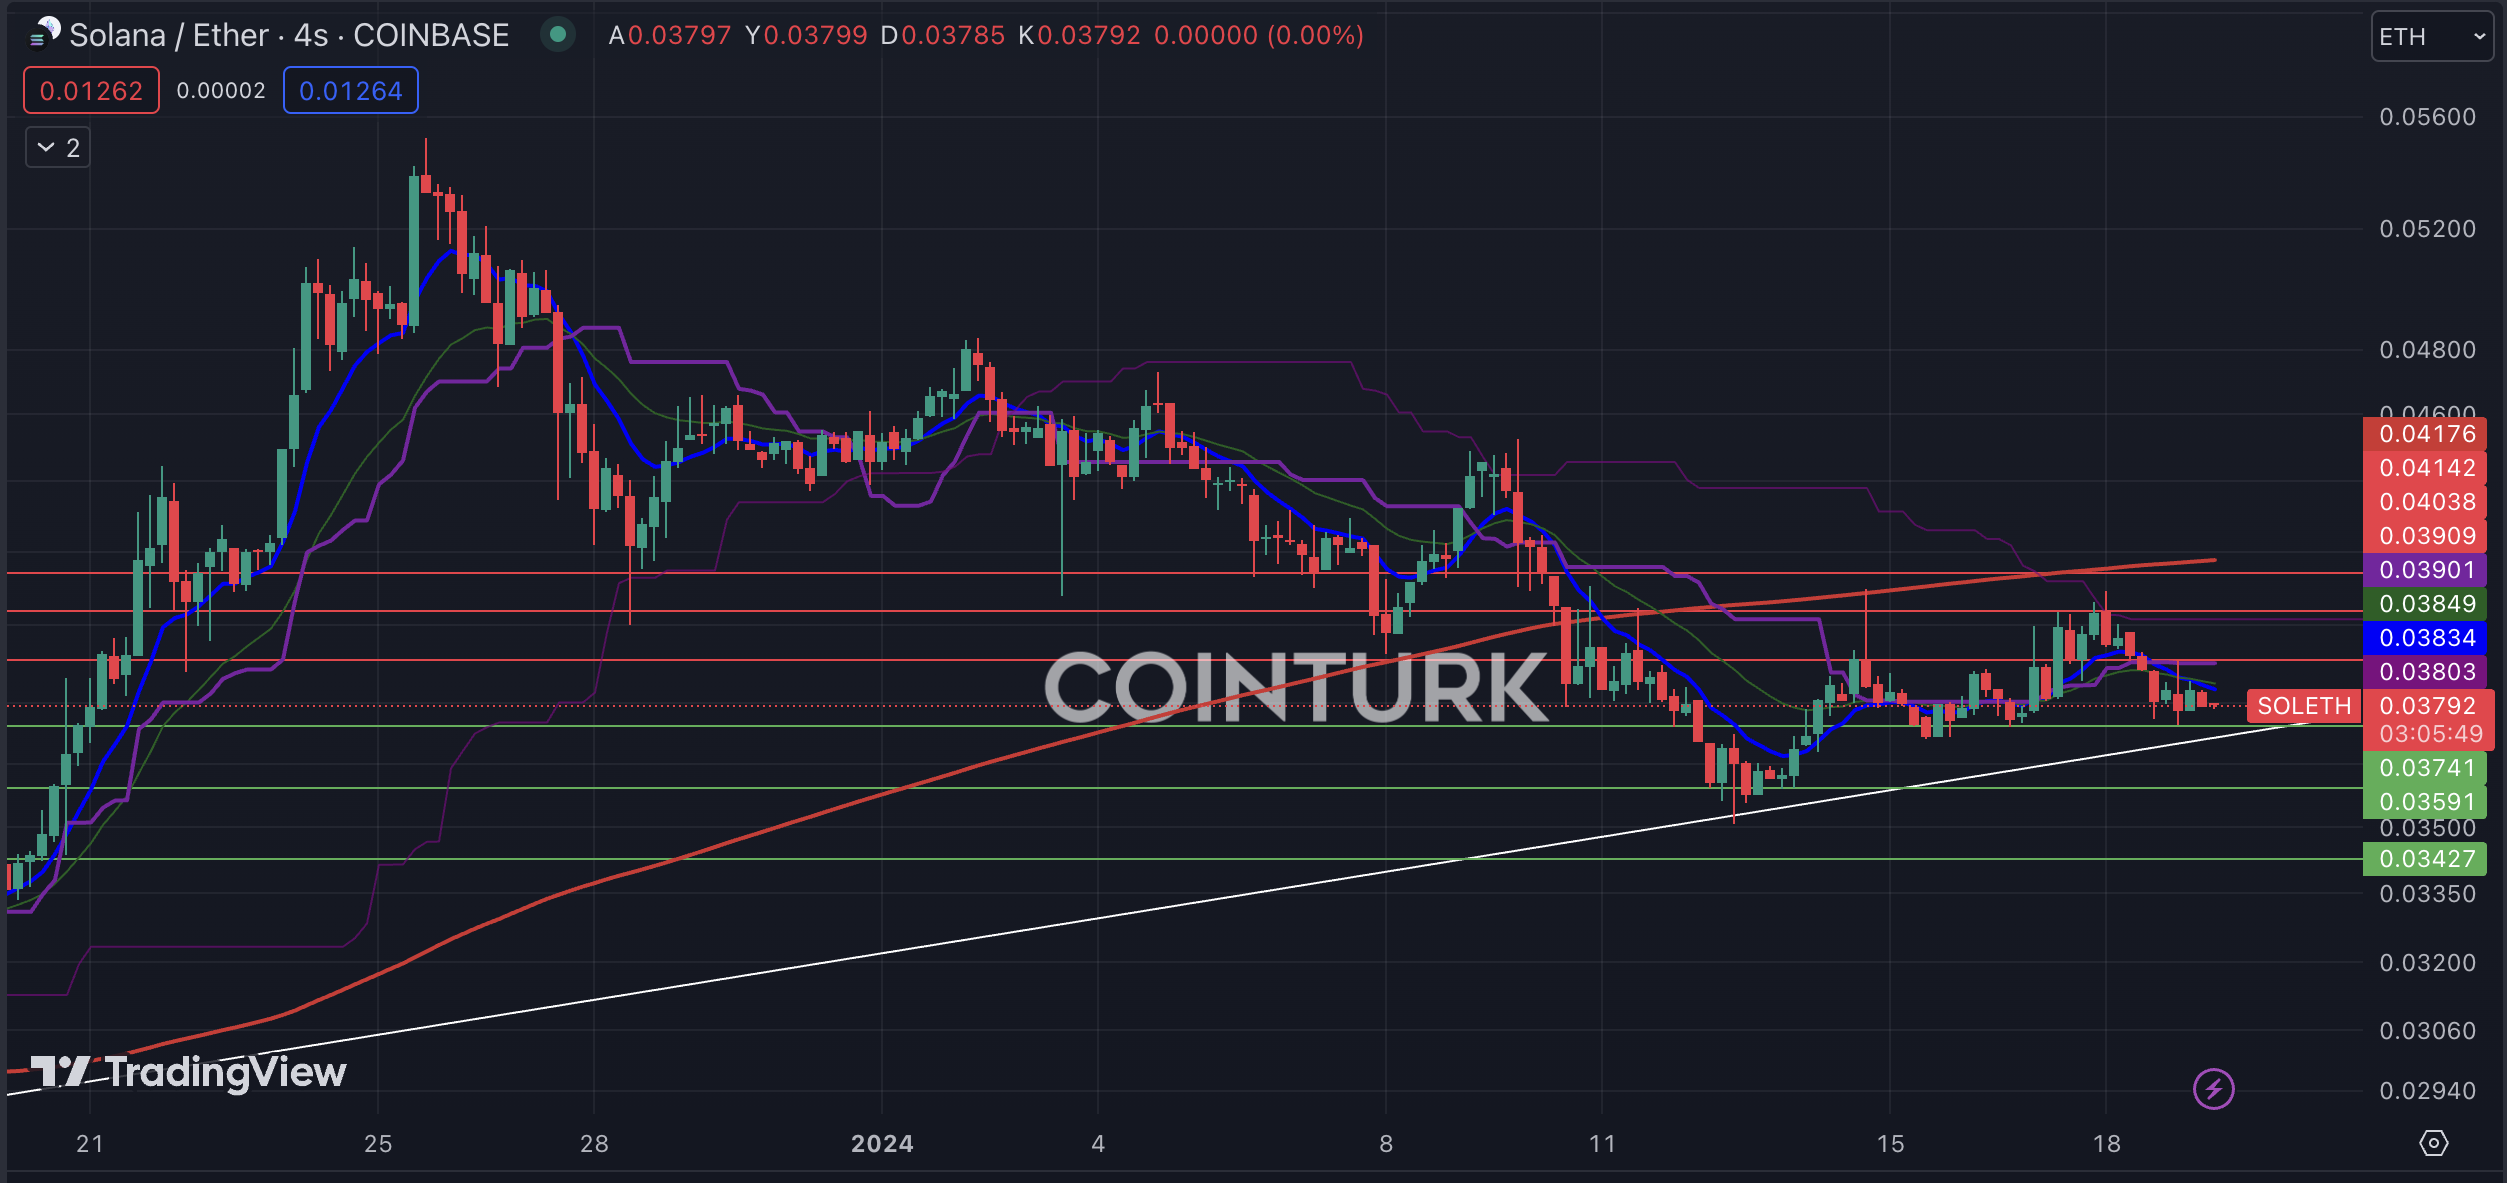
SOL/ETH pair has recently experienced a notable decline with Ethereum’s price gaining momentum, and the rising trend line acting as support has not yet created a negative impact on Solana’s price. However, the bar closings over the last week being below the EMA 200 level could lead to Solana losing value against Ethereum.
The most important support levels to follow on the four-hour SOL/ETH chart are, respectively; 0.03741, 0.03591, and 0.03427. Especially, a four-hour bar closing below the 0.03741 level, which intersects with the trend line, will cause Solana to lose value against Ethereum.
The most important resistance levels to watch on the four-hour SOL/ETH chart are, respectively; 0.03909, 0.04038, and 0.04142. Particularly, a four-hour bar closing above the 0.04142 level, which intersects with the EMA 200, will enable Solana to gain value against Ethereum.


 Türkçe
 Español


