COINTURK NEWSCOINTURK NEWSCOINTURK NEWS
  • Real-Time News Feed
  • Bitcoin
  • Altcoin
  • Ethereum
  • Technology News
  • Advertise
  • Contact
  • TURTURTUR
  • ESESES
Search
© 2024 COINTURK NEWS. All Rights Reserved.
Reading: Technical Analysis of TIA and EDU Cryptocurrencies
Share
Languages
  • TürkçeTürkçe
  • EspañolEspañol
Font ResizerAa
COINTURK NEWSCOINTURK NEWS
Font ResizerAa
Search
  • Real-Time News Feed
  • Bitcoin
  • Altcoin
  • Ethereum
  • Technology News
  • Advertise
  • Contact
  • TURTURTUR
  • ESESES
Follow US
© 2025 BLOCKCHAIN Information Technologies. >> COINTURK NEWS
Powered by LK SOFTWARE
COINTURK NEWS > Altcoin News > Technical Analysis of TIA and EDU Cryptocurrencies
Altcoin News

Technical Analysis of TIA and EDU Cryptocurrencies

In Brief

  • Technical analysis is crucial for cryptocurrency traders.

  • TIA and EDU show significant support and resistance levels.

  • Breakouts and closures above these levels could drive momentum.

COINTURK NEWS
COINTURK NEWS 1 year ago
Share
SHARE

In the cryptocurrency market, technical analysis emerges as an indicator that investors, especially those trading in the futures market, must continuously monitor. So, what kind of clues does technical analysis provide for TIA, which was trading at $13.69, and EDU, trading at $0.7170, at the time the article was written? We examine it with detailed chart analysis and key support and resistance levels.

Contents
Celestia Chart AnalysisEDU Chart Analysis

Celestia Chart Analysis

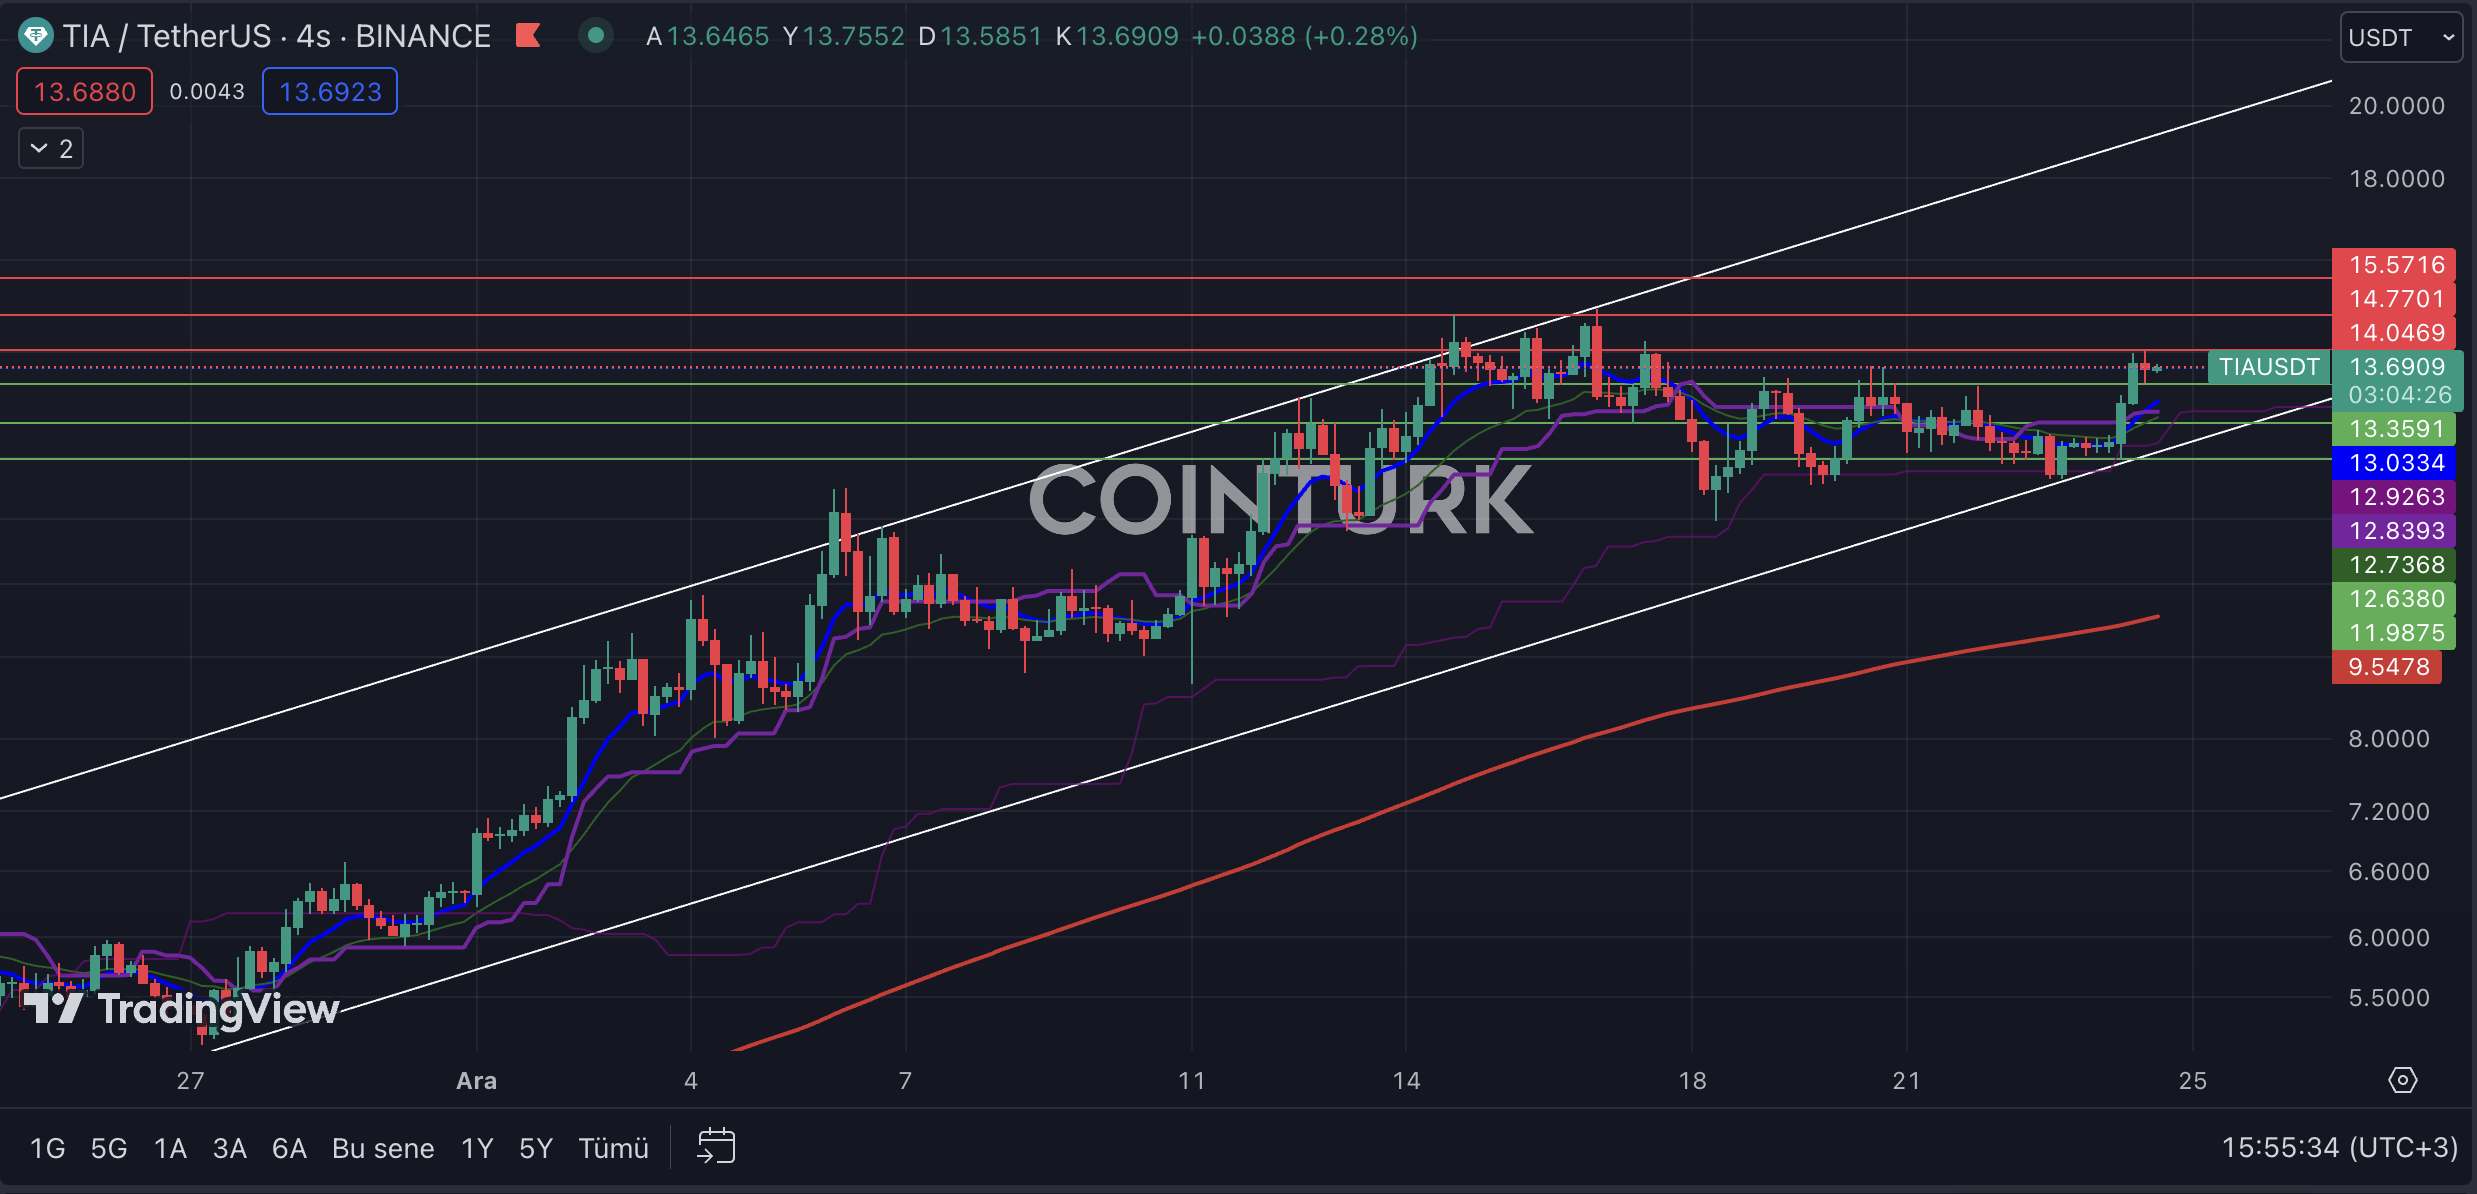
The first noticeable formation structure in the four-hour TIA chart is the ascending channel formation. TIA, which was trading at $5.50 on November 27, managed to maintain this formation structure up to the $14.77 level. The breakout seen on the resistance line on December 5th only acted as a bull trap, leading many investors to be misled.

The most important support levels to watch on the four-hour TIA chart are; $13.35 / $12.63 and $11.98, respectively. Particularly, a four-hour bar closure below the $13.35 level, which has been acting as resistance since December 18, will lead to selling pressure on the TIA front.

The most important resistance levels to follow on the TIA chart are; $14.04 / $14.77 and $15.57, respectively. A four-hour bar closure above the $14.04 level, which has been a significant obstacle in the last bar formations, will accelerate the TIA price.
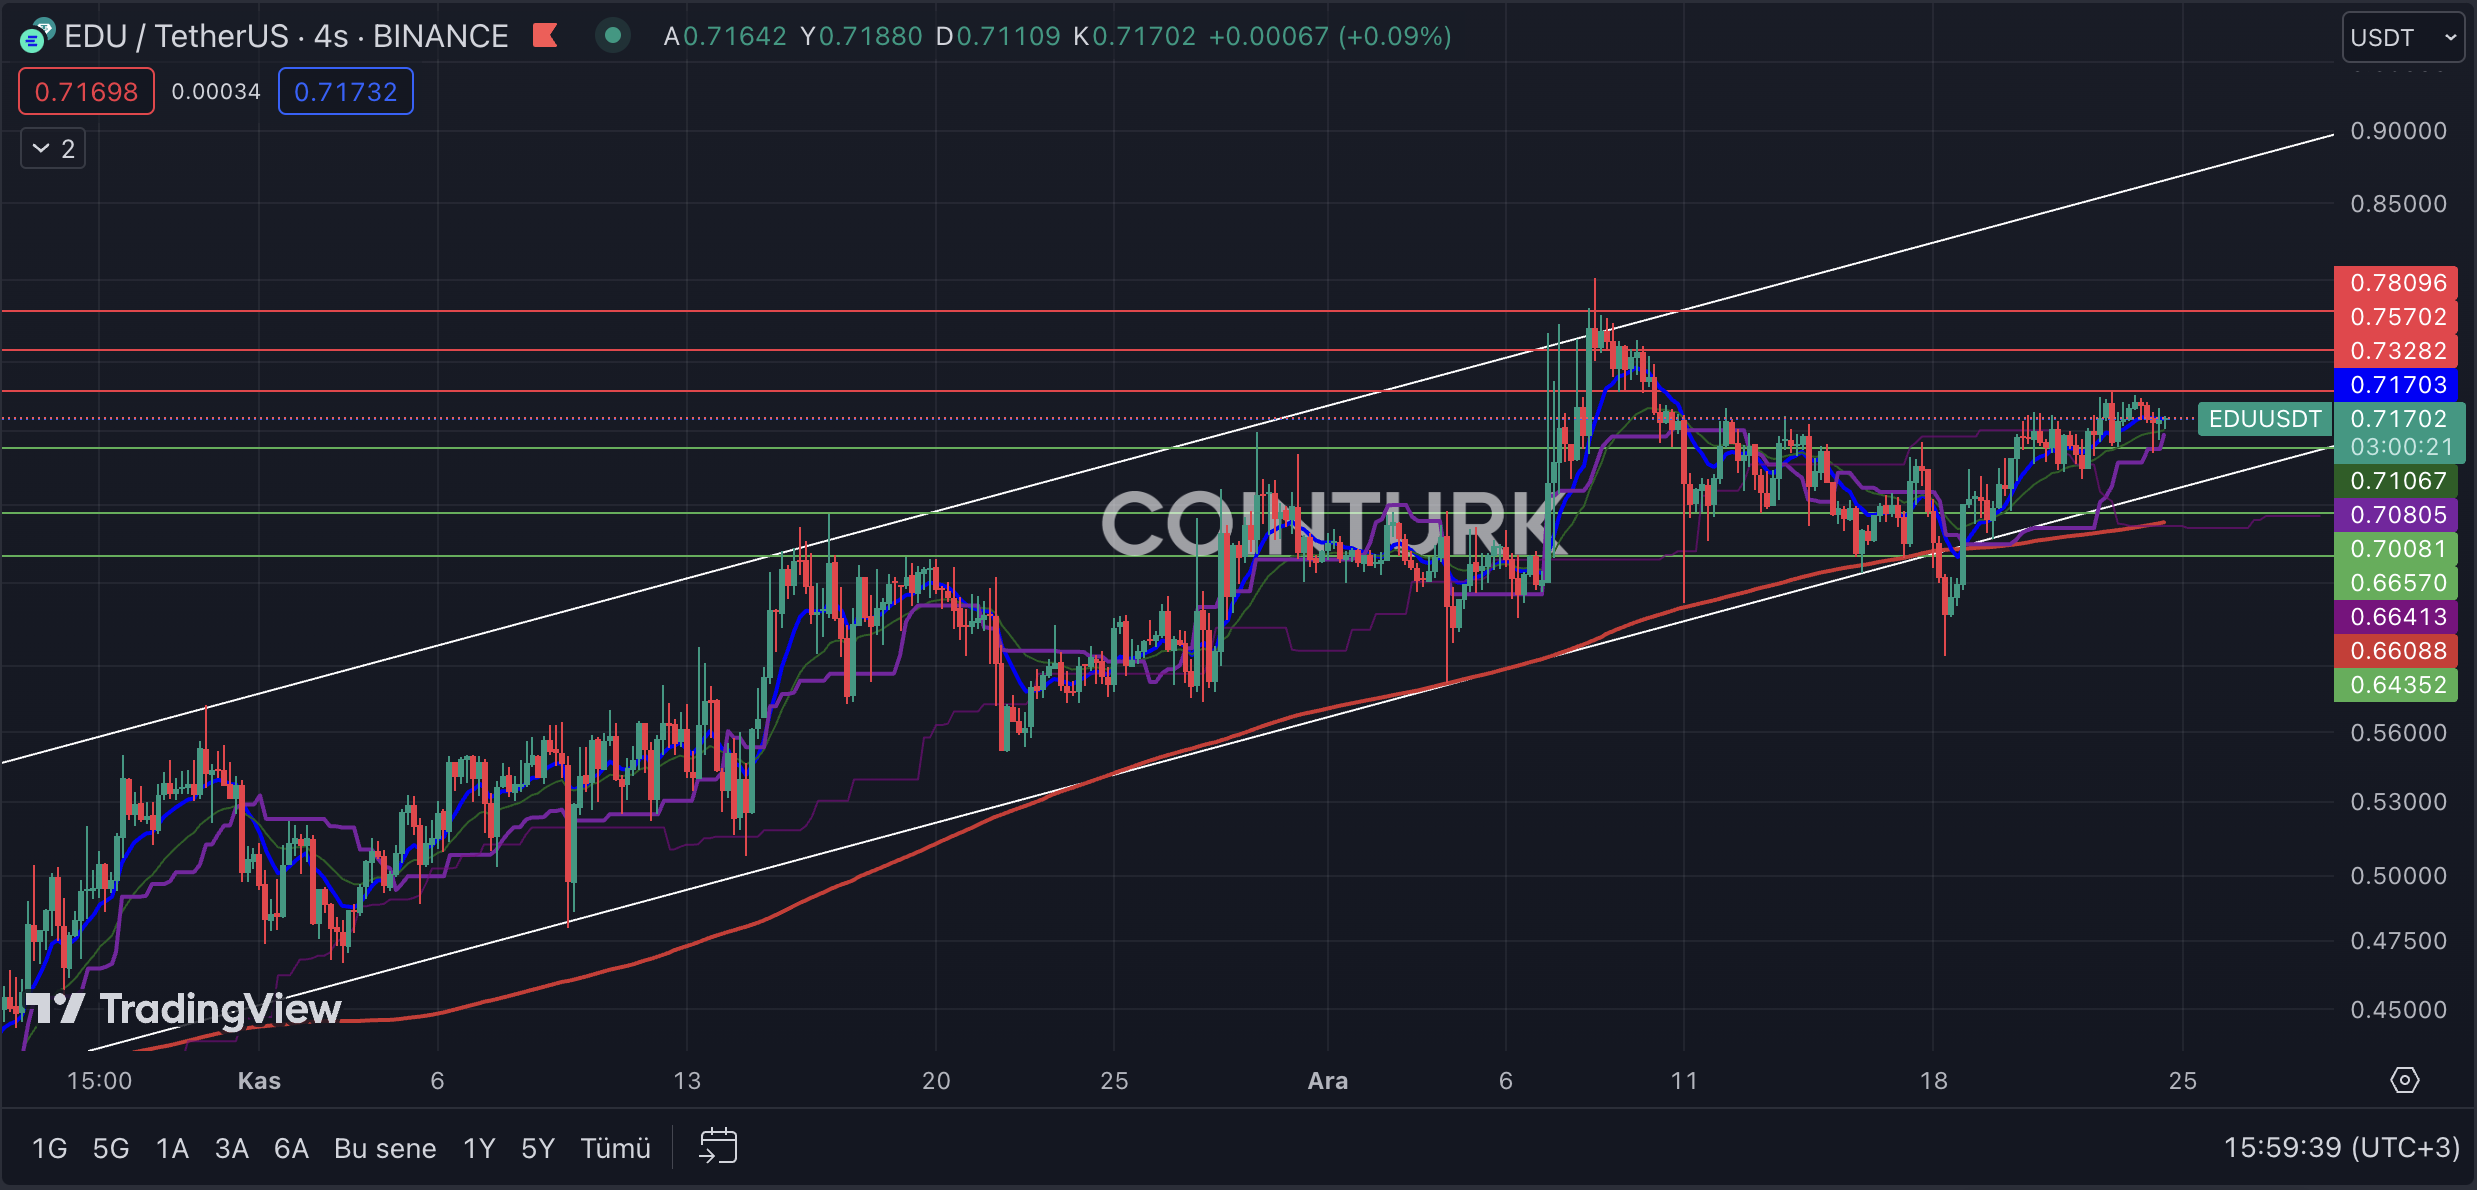
EDU Chart Analysis

The most important formation structure to pay attention to in the four-hour EDU chart is the ascending channel formation. The support break that occurred on December 18 within this formation structure caused fear and concern among investors but then managed to recover, and the price gained upward momentum from these levels. Such bear traps can particularly mislead futures traders and lead to significant losses.

The most important support levels to monitor in the EDU chart are; $0.7008 / $0.6657 and $0.6435, respectively. Especially a four-hour bar closure below the $0.7008 level, which is squeezed in a narrow area and intersects with the EMA 21 (green line), will cause significant selling pressure on the EDU price.

The most important resistance levels to pay attention to in the EDU chart are; $0.7328 / $0.7570 and $0.7809, respectively. A four-hour bar closure above the $0.7328 level, which has been a significant barrier in the last bar closures, will help the EDU price gain momentum.

You can follow our news on Telegram, Facebook, Twitter & Coinmarketcap
Disclaimer: The information contained in this article does not constitute investment advice. Investors should be aware that cryptocurrencies carry high volatility and therefore risk, and should conduct their own research.

You Might Also Like

MetaMask Stirs Buzz with Possible Altcoin Launch

Pi Coin’s Dramatic Drop Raises Questions About Its Future

Solana Bounces Back: Unveiling Promising Altcoins and Future Prospects

JPMorgan Pushes Its Unique Crypto Network Forward

Crypto Markets Surge as Altcoins Eye Dramatic Upswing

COINTURK NEWS 24 December, 2023 - 10:06 pm 24 December, 2023 - 10:06 pm
Share This Article
Facebook Twitter
Share
Previous Article Technical Analysis of Bitcoin: Key Levels and Patterns
Next Article Ethereum Technical Analysis: Key Levels and Trends
Leave a comment

Leave a Reply Cancel reply

Your email address will not be published. Required fields are marked *

This site uses Akismet to reduce spam. Learn how your comment data is processed.

Stay Connected

8.1k Like
21.1k Follow
1.1k Follow

Latest News

MetaMask Stirs Buzz with Possible Altcoin Launch
Altcoin News
BTCS Makes Strategic Moves to Acquire Ethereum
Ethereum (ETH)
Cardano Innovates with Midnight Update and Glacier Airdrop
Cardano (ADA)
Pi Coin’s Dramatic Drop Raises Questions About Its Future
Altcoin News
//

COINTURK was launched in March 2014 by a group of technology enthusiasts who believe that Bitcoin will be as important as the internet in the world of the future thanks to the amazing technology underlying it.

CRYPTOCURRENCY LIVE PRICES

  • Bitcoin (BTC) Live Price
  • Ethereum (ETH) Live Price
  • Ripple (XRP) Live Price
  • Solana (SOL) Live Price
  • Dogecoin (DOGE) Live Price
  • Cardano (ADA) Live Price
  • Chainlink (LINK) Live Price

OUR PARTNERS

  • COINMARKETCAP
  • COINGECKO
  • BITCOINHABER
  • BH NEWS
  • 21MILYON
  • NEWSLINKER

OUR COMPANY

  • About Us
  • Cookie Policy
  • Advertising
  • Contact
COINTURK NEWSCOINTURK NEWS
Follow US
© 2025 BLOCKCHAIN Information Technologies. >> COINTURK NEWS
Powered by LK SOFTWARE
Welcome Back!

Sign in to your account

Lost your password?