The Fear and Greed Index has once again risen above 75 as of today. Such situations in the cryptocurrency market can last for weeks or even months. Considering the events of 2019-2020, the possibility of a deeper correction seems to be causing concern among investors. If Bitcoin experiences a sharp decline before the halving, it could revisit the $20,000 region. This scenario could lead to similarities with the price movements and events that occurred before the previous halving.
Fear and Greed Indicator Insights
The current values of the Fear and Greed Index are showing 76. This points to the onset of extreme greed among investors. Generally, such chart patterns indicate an impending correction, but there is no certainty.
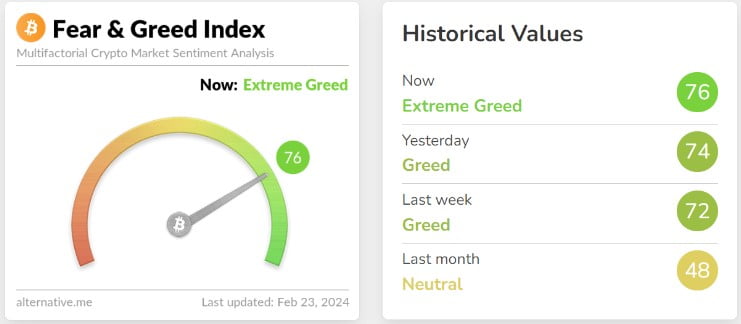
The previous month’s Fear and Greed Index was at 48, which was followed by a sharp increase. The mentioned value of 48 is a sentiment that emerges among market participants when they feel the market is in a consolidation phase.
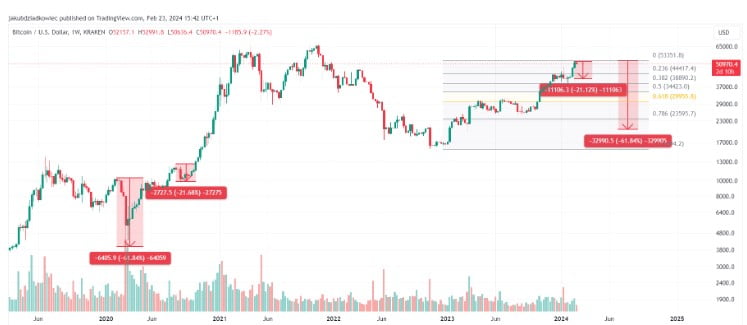
A similar period occurred in May 2020, which was preceded by an extremely volatile BTC price. The peak of this volatility was marked by a 62% drop in Bitcoin’s price in March 2020, largely attributed to the massive market crash caused by COVID-19.
The graph below shows striking similarities in two fractals (red areas). Initially, the rise in the Fear and Greed Index was considered to be linked to the systematic BTC price increase from macro low levels.
The growth experienced in 2020 moved the index into the greed zone (above 55). On the other hand, today’s data shows a further increase. This is evidenced by the readings above 75 seen in the last few days.
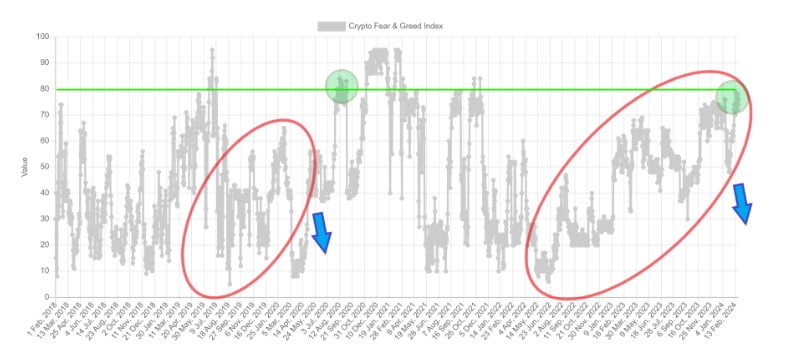
The 2020 crash eventually led to the Fear and Greed Index dropping to the extreme fear level of 10. This happened three months before the past halving of Bitcoin. Considering the current conditions, as the market becomes increasingly complex two months before the halving, the possibility of a harsher correction (blue arrow) remains plausible.
Extreme Greed and Potential BTC Price
On the other hand, it would be accurate to say that the Fear and Greed Index did not reach the extreme greed area before the previous halving. Unlike the current situation, the index reflected extremity only after the BTC price reached the $12,000 area (green area in the graph above).
It’s important to remember that the first test of this resistance (green line) was met with rejection, and Bitcoin fell below $10,000 for a period in September 2020. In such a case, a correction of approximately 21% could be within the realm of possibility, potentially bringing the price back down to the $40,000 level.
However, despite all these structural similarities, it’s important to remember that not every Bitcoin cycle will be the same. Perhaps the extreme readings on the Fear and Greed Index this time will not lead to a deep correction.

 Türkçe
 Español


