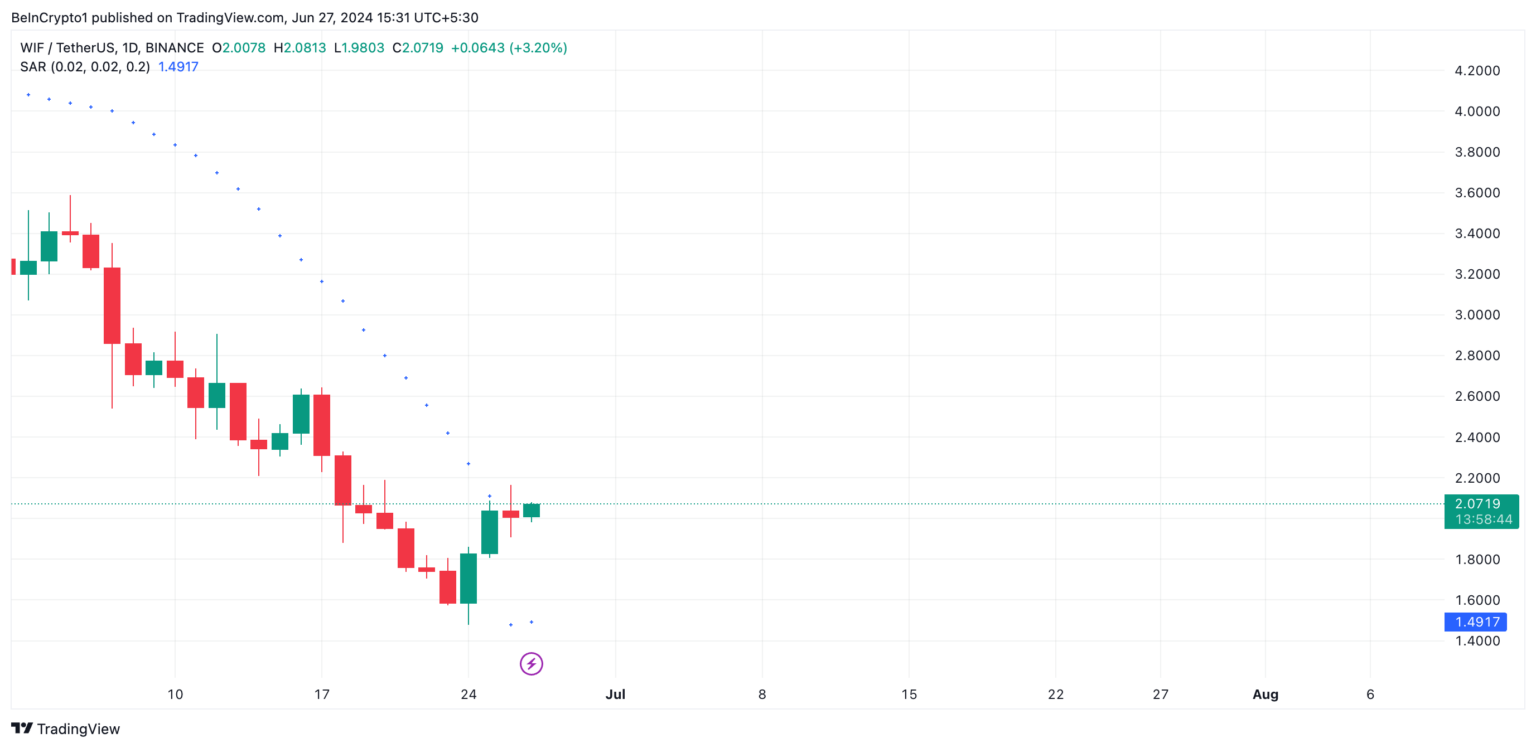
Dogwifhat (WIF) price dropped to its lowest level of the year at $1.82 on June 25. Since then, WIF price has seen a notable 13% increase, trading at $2.05 at the time of writing. Some of WIF’s technical indicators suggest a gradual resurgence in the bullish trend for the memecoin project.
What’s Happening with WIF?
On the daily chart, the Parabolic Stop and Reverse (SAR) indicator points are currently below the price of WIF. This indicator measures the direction or price movements of an asset, and when the dotted lines are placed below the price, it suggests a bullish market trend. This development indicates to investors that the asset’s price is rising and the trend may continue.

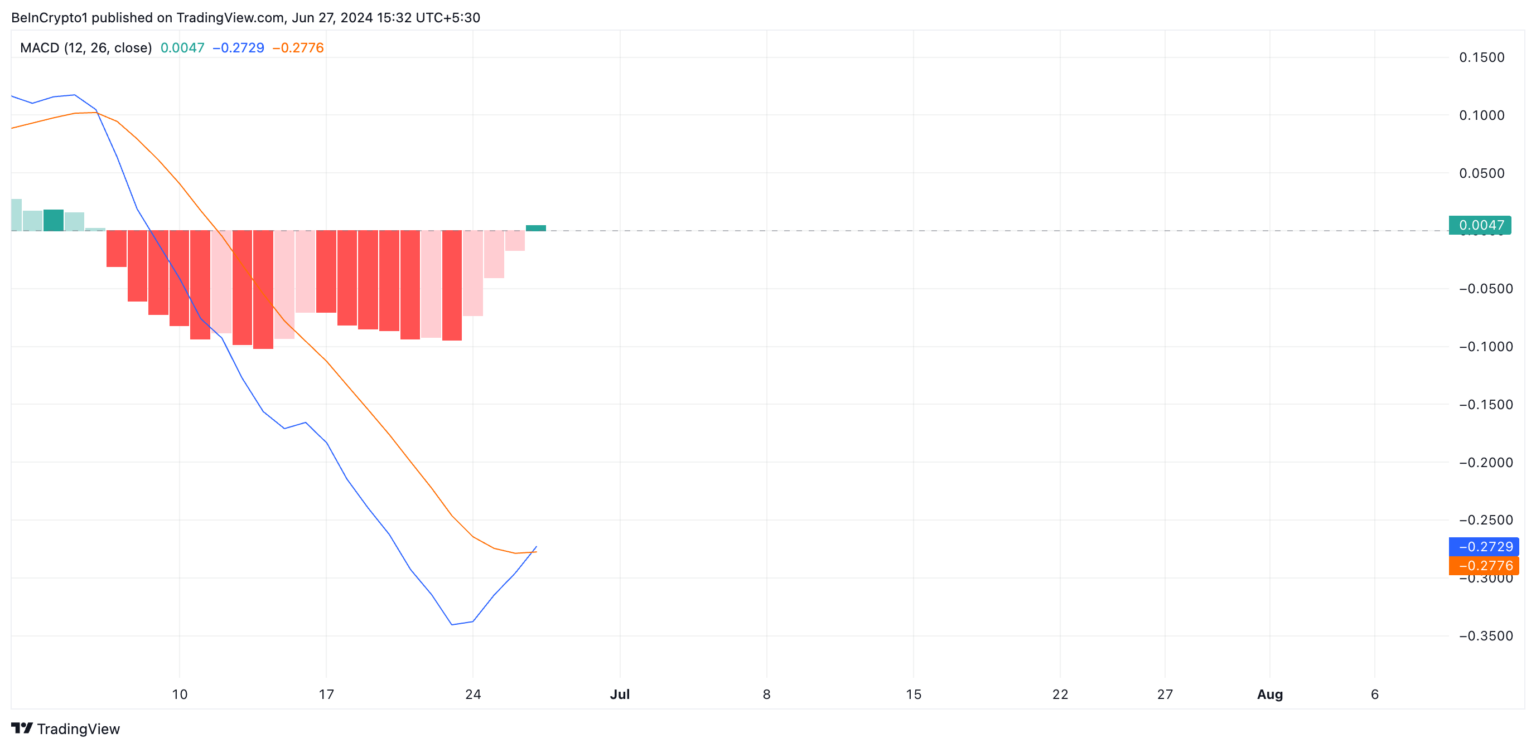
These points were placed above the WIF price between June 2 and June 24, indicating a decline in the value of the memecoin project. However, on June 25, a shift occurred, showing that the market trend had changed from bearish to bullish. As of the time of writing, WIF’s Moving Average Convergence Divergence (MACD) data indicates that the MACD line (blue) is ready to cross above the signal line (orange).

This indicator measures changes in the strength, direction, momentum, and duration of an asset’s price. The MACD line crossing above the signal line can be a bullish sign, indicating that the asset’s short-term moving average has surpassed its long-term moving average.
WIF Chart Analysis
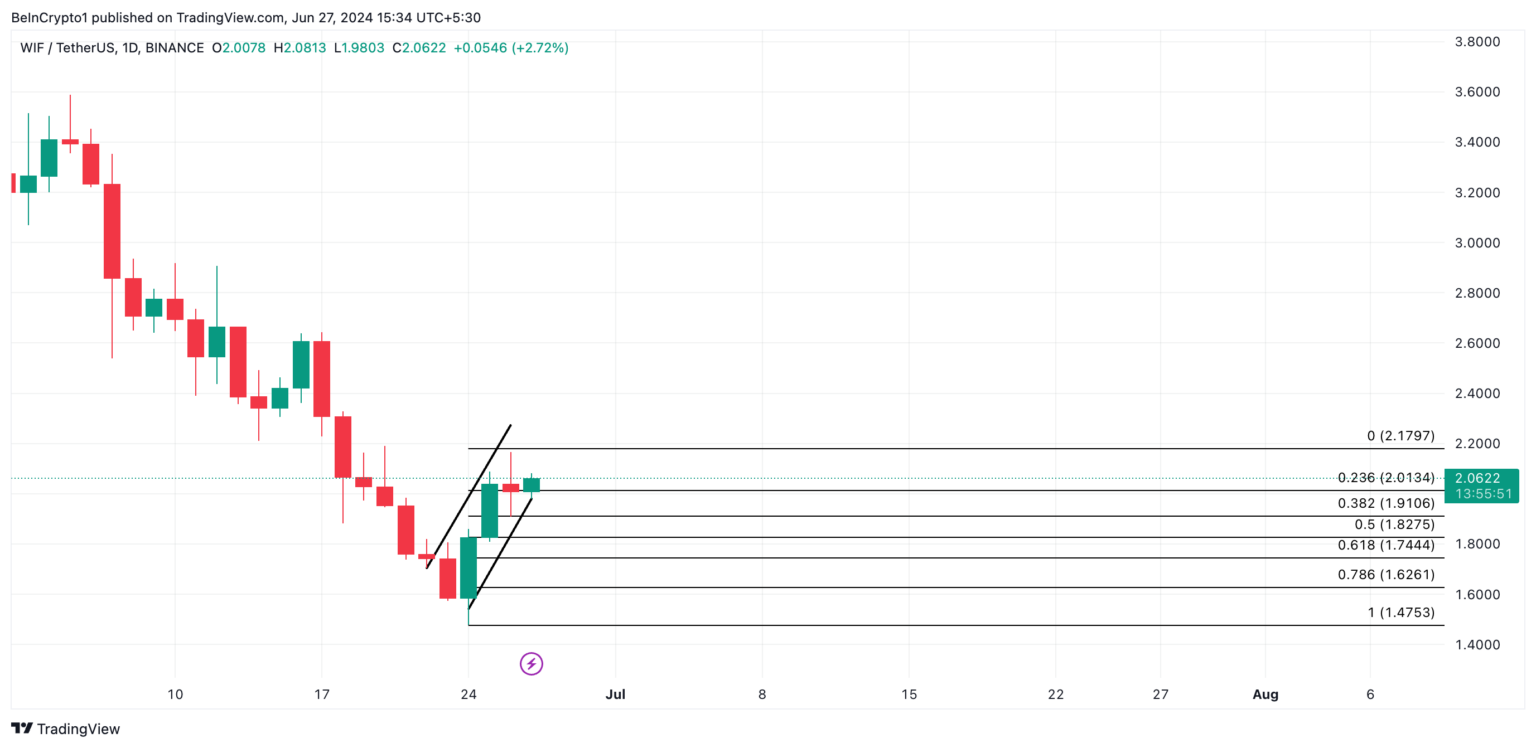
The rise in WIF price has gradually led to the formation of an ascending channel, which occurs when an asset’s price consistently makes higher highs and higher lows within a limited price range. If this trend continues, the value of the memecoin could rise to $2.17. However, if WIF loses these gains, its price could drop to $1.19.

Developments in the crypto market have led to notable selling pressures in memecoin projects. This situation could be mitigated by positive macroeconomic data from the United States and potential positive developments regarding Ethereum ETF funds.

 Türkçe
 Español


