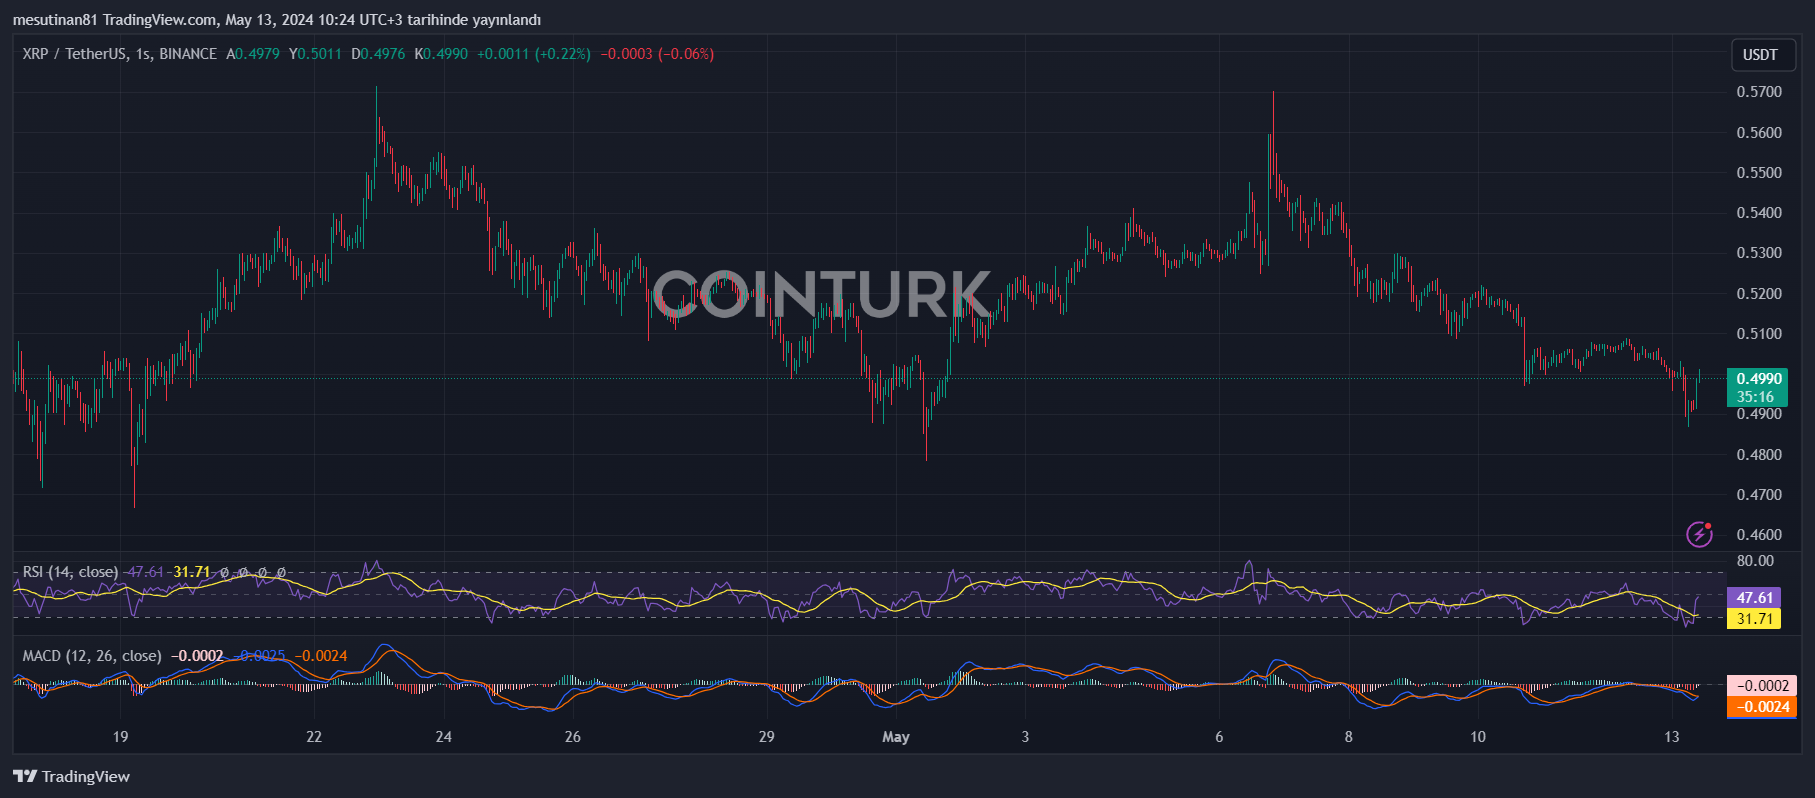
The cryptocurrency market has been quite volatile lately. At the center of this fluctuation is XRP, which has recently entered a downtrend starting from the $0.5050 resistance area. Currently, the price is trading below the critical support of $0.4865, and closing below this support level could lead to further declines.
XRP Expands Its Losses
XRP’s losses have widened, now trading below the $0.500 support. A significant downtrend line has formed at the $0.4980 resistance for XRP. This situation indicates that the pair could retreat further towards a support at $0.4550 in the near term.
Recently, although XRP’s price attempted a recovery wave above the $0.5050 level, bears effectively dominated the market. Along with other cryptocurrencies like Ethereum and Bitcoin, Ripple (XRP) price experienced a sharp decline below the $0.500 support.
A movement below the $0.4920 and $0.4880 levels occurred, and the downtrend accelerated. The lowest level dropped to $0.4867, and currently, the price is trying to balance these losses.
Should These Resistance Levels Be Watched for Price?
In the upcoming period, the most significant resistance the price will face is around $0.500. A close above this level could initiate a strong upward trend. However, there are still some challenges ahead for the price, especially the $0.5085 resistance level.
If bulls overcome this resistance level, a rally towards the $0.5250 resistance could be possible. However, for further gains, the price needs to advance towards the $0.550 resistance.
What Does Technical Analysis Say About XRP’s Condition and Future?
Currently, if XRP cannot surpass the $0.50 resistance area, a new downtrend may begin. Technical analysis shows that the first support level in a downward move is around $0.4865. If this support level is broken, the next main support point is at $0.4780.

However, if a close below this level occurs, it is indicated that the price could fall further. In this scenario, it seems likely that XRP will retest the $0.450 support region. Looking at the technical indicators, the hourly MACD indicator for the XRP/USD pair is gaining momentum in a downward trend. Similarly, the hourly RSI (Relative Strength Index) is also trending below the 50 level, indicating that selling pressure may continue.
Key support levels for XRP are identified at $0.4865 and $0.4780, while resistance levels are at $0.500 and $0.5085. Therefore, XRP’s near-term performance appears to depend on whether these support and resistance levels are breached.

 Türkçe
 Español


