S&P 500 experienced a decline in the last four days of the previous week, but this did not significantly affect the price of Bitcoin. This situation drew attention as a positive indicator for Bitcoin, which has been moving in coordination with the US stock markets for a while. So, which altcoins can rise with Bitcoin in a possible rally? Let’s examine together.
In the short term, there is still uncertainty about the next direction of the price of Bitcoin. Many analysts warn that this situation could be a trap set for investors. Among these traps, there may be pressure on the prices of several major altcoins, and some altcoins are already showing signs of recovery.
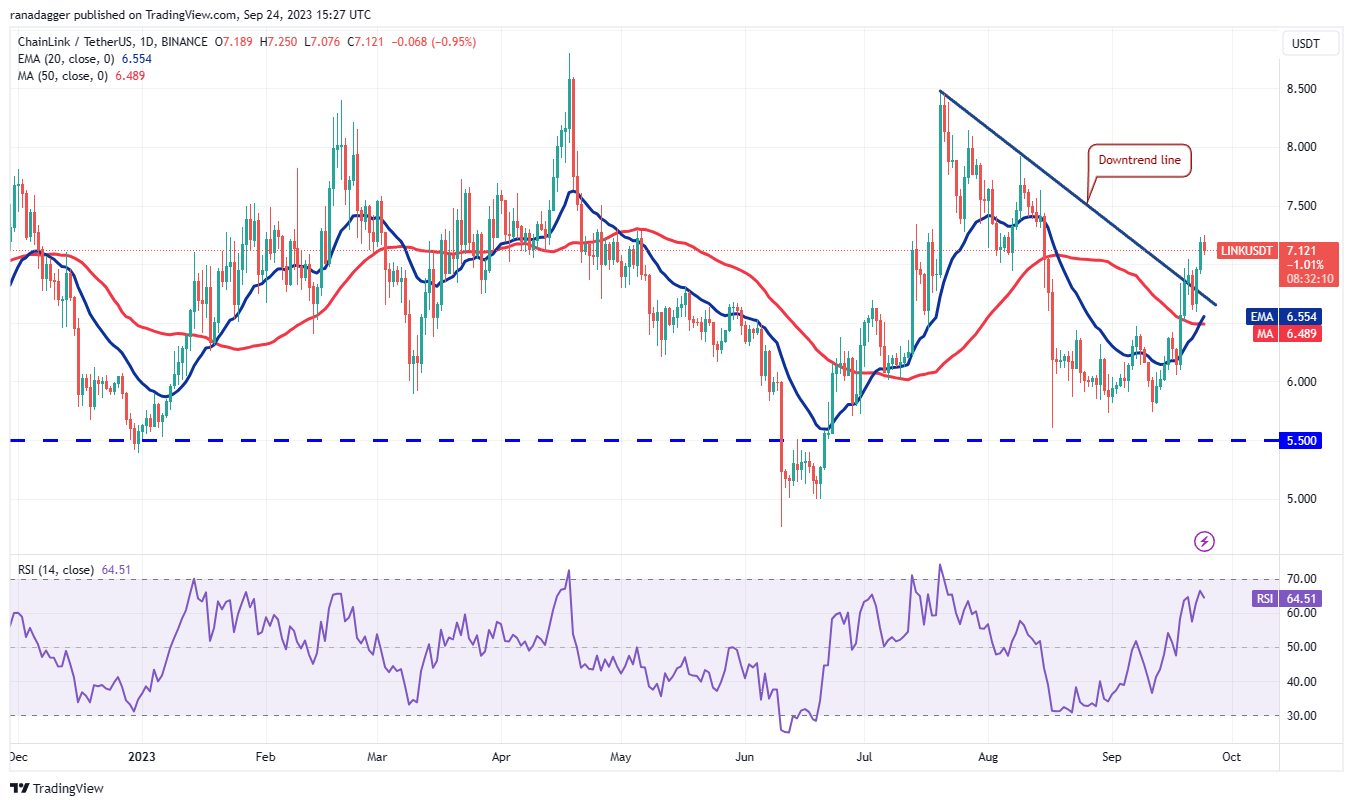
Chainlink Chart Analysis
The price of ChainLink recently crossed above the moving averages and the RSI is in the positive zone. This indicates that buyers have the upper hand in the order book. In any correction, it is likely that investors will buy the dips up to the 20-day EMA average ($6.55). A strong recovery from this level will enable investors to buy tokens in possible declines.
As the bulls mature on the chart, they will try to push the upward movement to $8 and eventually to $8.50. If the bears want to prevent the rise, they will have to push the LINK/USDT pair below the 20-day EMA average and sustain the decline.
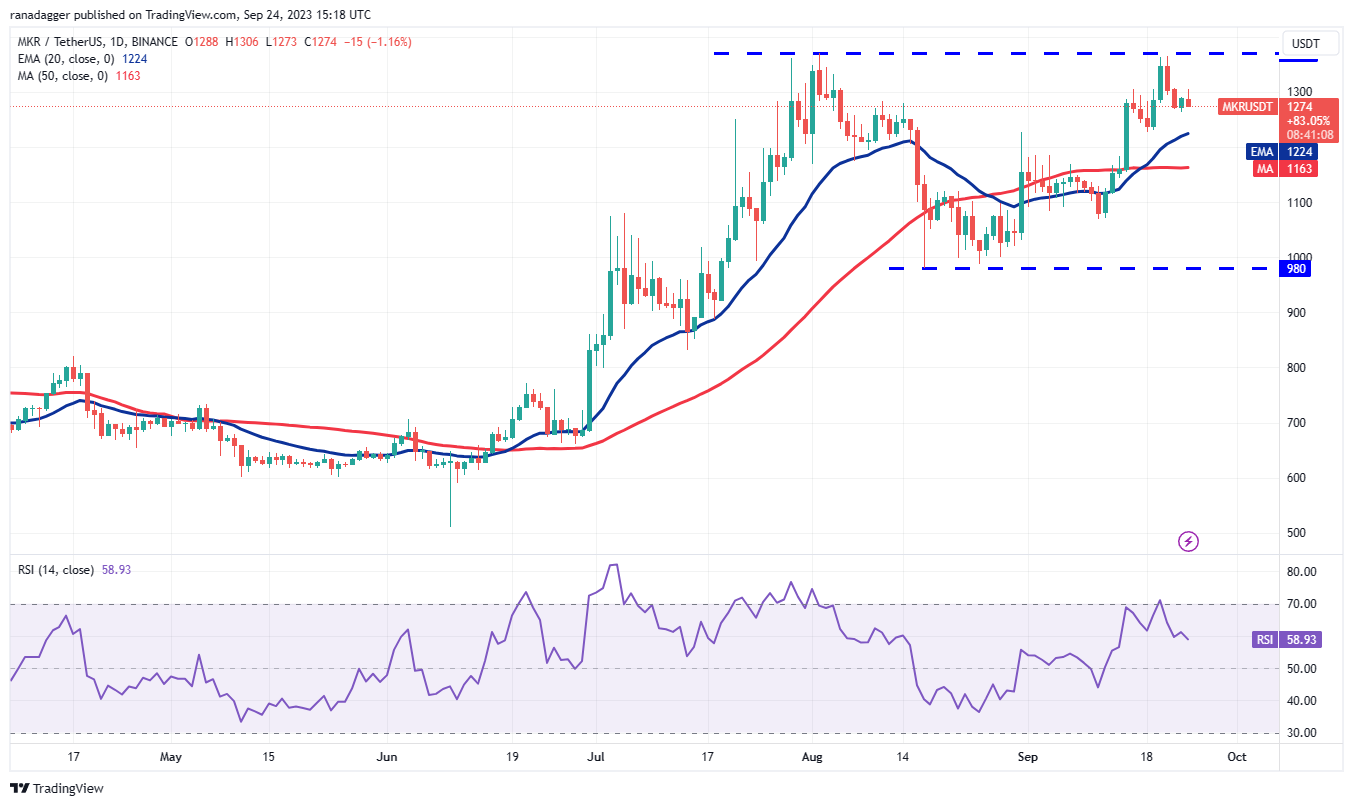
Maker Chart Analysis
The 20-day EMA average ($1,226) is a support level to watch for downward movement. If the price recovers from this level, it will indicate that lower levels continue to attract investors’ attention. Subsequently, the bulls will make another attempt to push the MK price above the resistance, and if successful, the MKR/USDT pair can achieve a rapid rise towards $1,759.
On the other hand, if the bears push the price below the 20-day EMA average, it will indicate a weakening of the upward momentum. This could keep the pair between $980 and $1,370 for a few days. The moving averages on the four-hour chart have converged at one point, and the RSI is just below the mid-level, indicating a balance between supply and demand. If buyers push the price above $1,306, the MKR price may rise to $1,370.
Arbitrum Chart Analysis
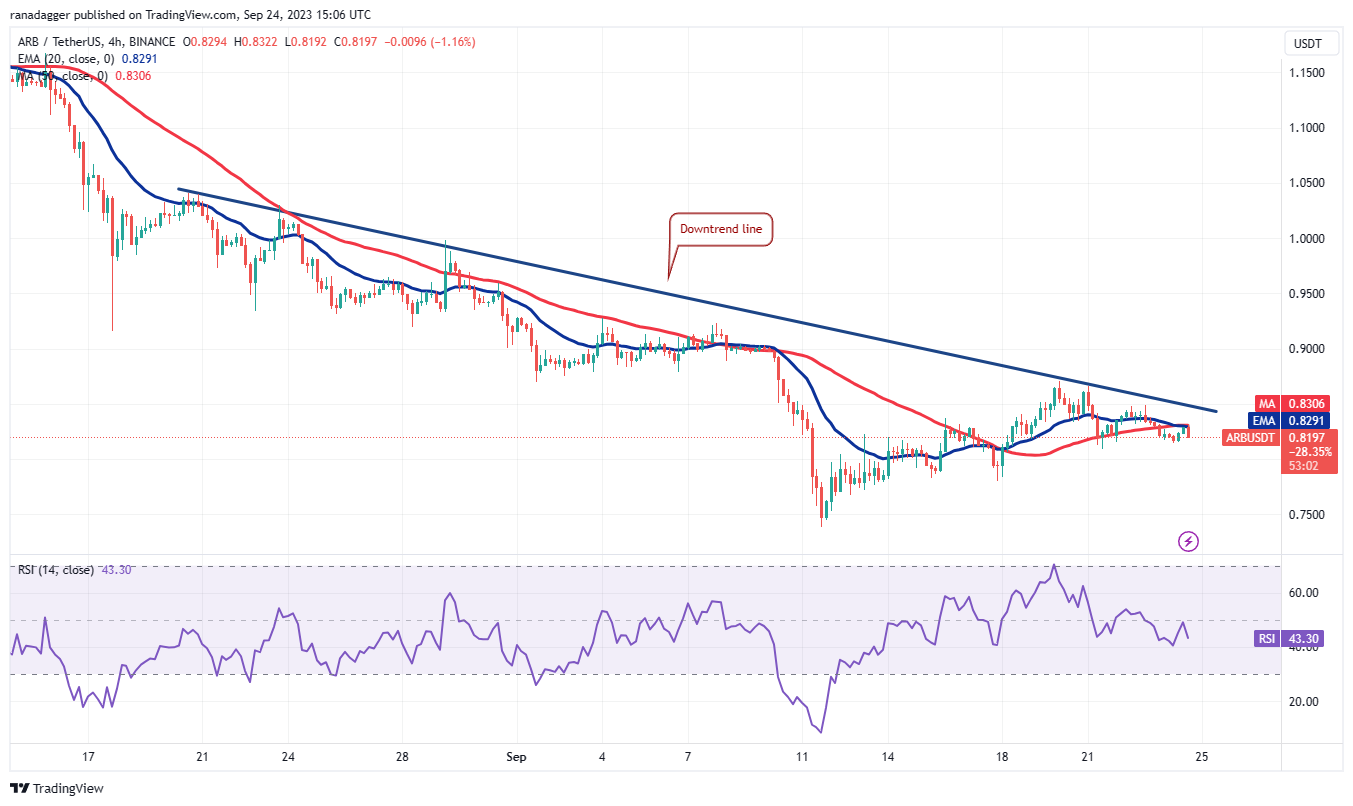
Arbitrum has been in a downtrend for a long time and has not been able to break free from it. The bears sell on rallies at the 20-day EMA average ($0.85), but it is positive that the bulls are also buying in this area. This indicates that the bulls are trying to maintain their positions in anticipation of a higher movement.
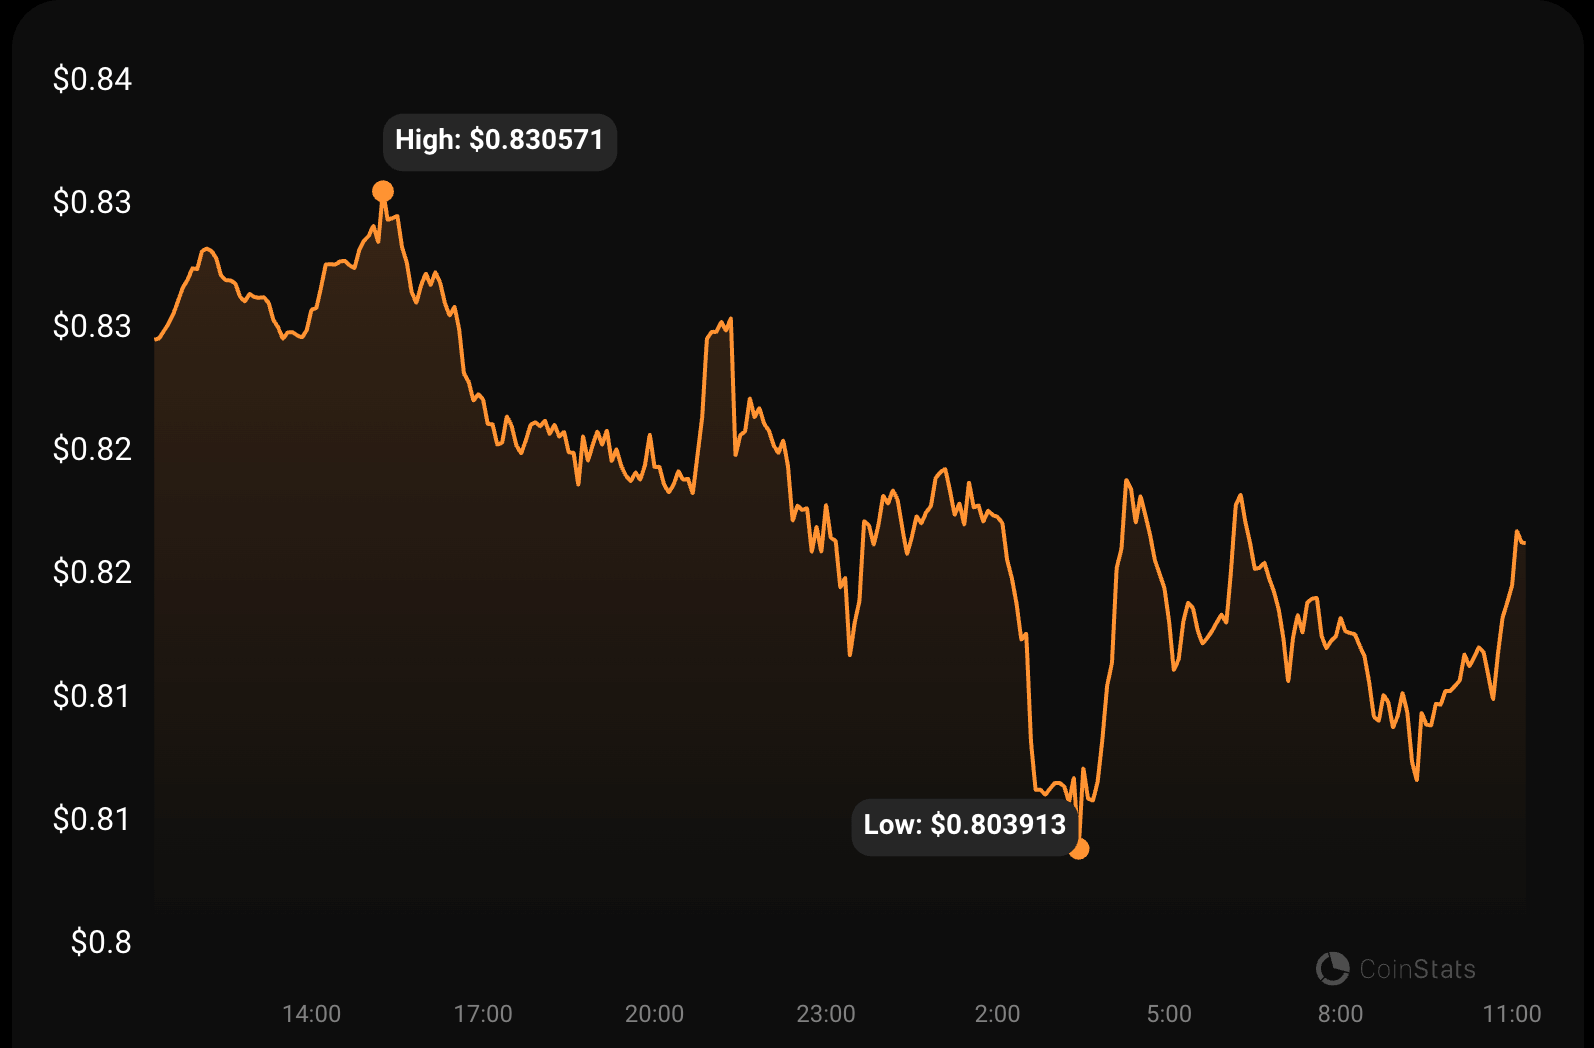
It can be seen that the RSI level is gradually turning positive as it crosses above 40. If buyers push the price above the 20-day EMA average, it will indicate the start of a recovery. The ARB/USDT pair could rise to the 50-day SMA ($0.95) and then to the $1.04 level.
The support levels to be followed are $0.80 and then $0.78. For sellers to make room for a retest of the support around $0.74, they need to push the ARB price below this level. A break below this level would indicate a resumption of the downtrend.
Theta Chart Analysis
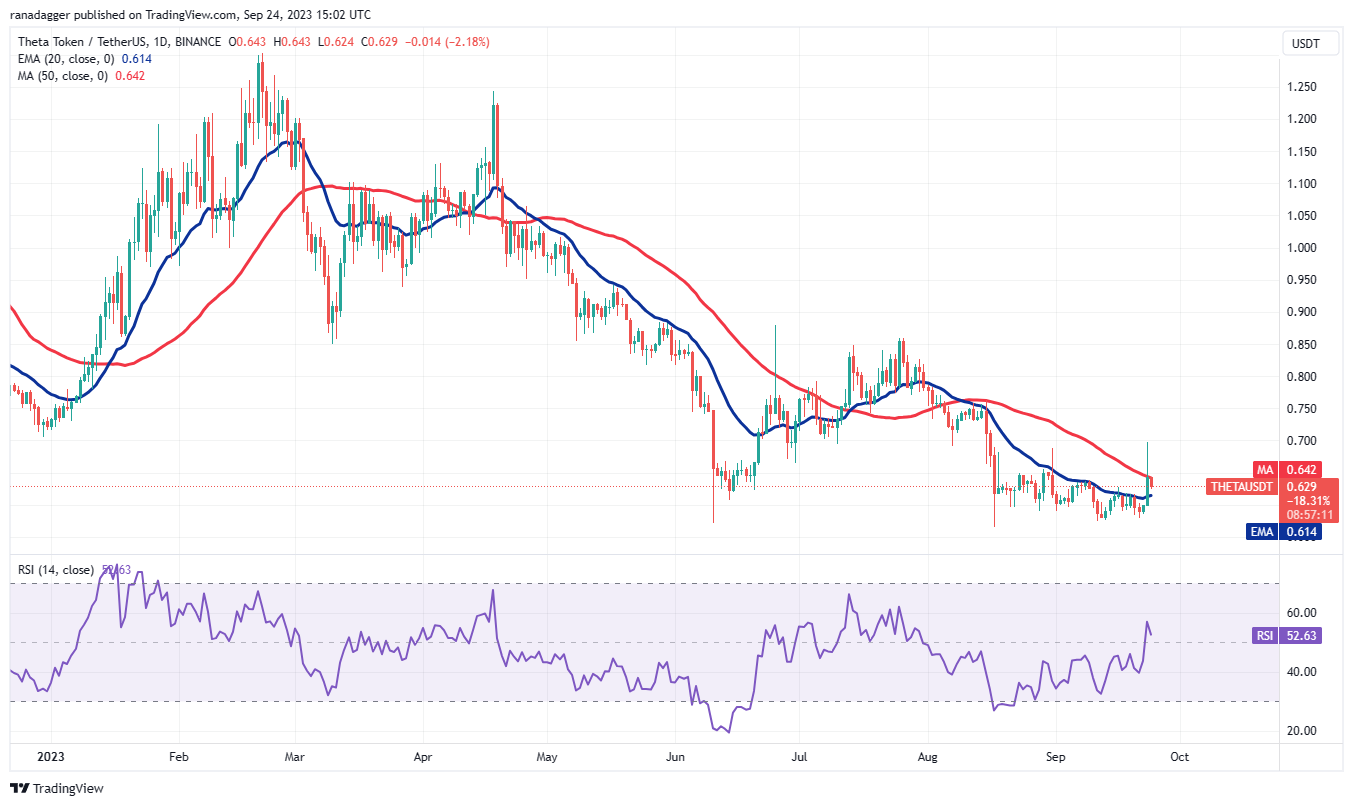
Theta Network showed an attempt to reverse by crossing above the 20-day EMA average ($0.61) on September 23, indicating a reduction in supply by bulls. However, the bears pulled the price back below the 50-day SMA ($0.64), but it is expected that the bulls will defend the 20-day EMA average. If THETA price rises from the current level and crosses above the 50-day SMA, there is a possibility of a test at $0.70.
This is an important level to consider because if it happens, the THETA/USDT pair could reach $0.76. This positive view will become invalid in the short term if the price falls below the 20-day EMA average. This would pave the way for a potential retest at $0.57.

 Türkçe
 Español


